Sidebar 3: Measurements
I used DRA Labs' MLSSA system and a calibrated DPA 4006 microphone to measure the PSB Alpha P5's frequency response in the farfield and an Earthworks QTC-40 mike for the nearfield responses. Because the tweeter is mounted at the base of the front baffle, my primary measurement axis was level with the woofer's dust cap. I left off the loudspeaker's vestigial grille for the measurements.
PSB specifies the Alpha P5's sensitivity as 87dB, presumably for 2.83V drive at 1m. My estimate was a little lower, at 85dB(B)/2.83V/m. The impedance is specified as 8 ohms with a minimum value of 4 ohms. The solid trace in fig.1 shows that 8 ohms is approximately the Alpha P5's average impedance, though it is close to 6 ohms in the treble. The minimum magnitude is 3.85 ohms at 190Hz, confirming PSB's specification, and while the electrical phase angle (dotted trace) reaches –43° at 105Hz, the magnitude at that frequency is 8.3 ohms. The PSB is not a particularly difficult load to drive, a good thing given that the amplifiers with which it will be partnered will probably be lower-priced and thus lacking heroic power supplies. A small discontinuity at 33kHz in the impedance traces suggests that this is the primary resonance of the aluminum-dome tweeter.


 The PSB's farfield response, averaged across a 30° horizontal window centered on the woofer axis, is shown as the black trace above 300Hz in fig.3. The midrange is slightly down in level, and there is a small, narrow-band suckout visible just below 4kHz. Other than that, the P5's balance is superbly flat and even up to 19kHz (footnote 1), above which the tweeter's output rapidly rolls off. The response with the grille is very similar, but with slightly more energy apparent between 5kHz and 10kHz but slightly less energy above 12kHz. Fig.4 shows the PSB Alpha P5's horizontal dispersion and reveals that the on-axis suckout between 3kHz and 4kHz fills in the speaker's sides. The contour lines in this graph are otherwise even, implying stable stereo imaging. In the vertical plane (fig.5), a suckout develops in the crossover region 10° above and 15° below the woofer axis.

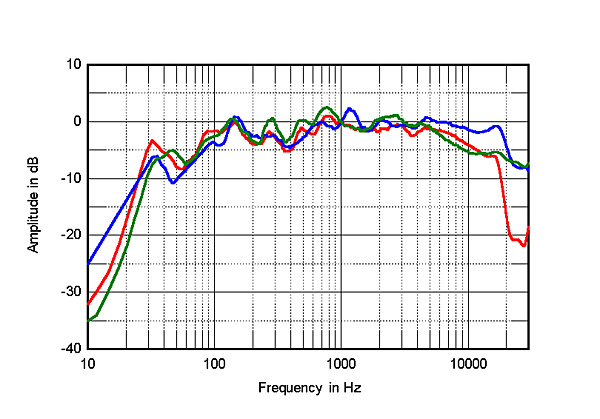
 The red trace in fig.6 shows the Alpha P5s' spatially averaged response with the grilles on in my room. This is generated by averaging 20 1/6-octave–smoothed spectra, taken for the left and right speakers individually using a 96kHz sample rate, in a vertical rectangular grid 36" wide by 18" high and centered on the positions of my ears. For reference, the blue trace shows the spatially averaged response of my 1978 Rogers LS3/5a's, the green trace that of the KEF LS50s I purchased following my review in 2012.
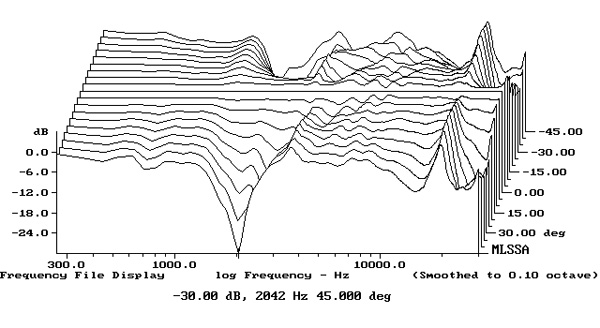
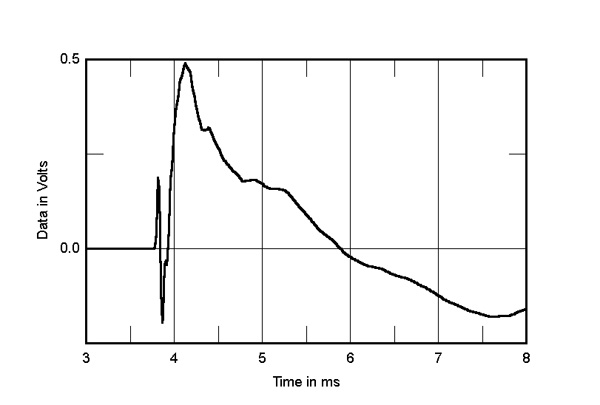
 In the time domain, the Alpha P5's step response (fig.7) indicates that the tweeter and midrange unit are connected in positive acoustic polarity. The decay of the tweeter's step, which arrives first at the microphone even with the latter on the woofer axis, smoothly blends with the start of the woofer's step. This suggests optimal crossover implementation. The PSB's cumulative spectral-decay plot (fig.8) is relatively clean overall, particularly in the treble. However, a small ridge of delayed energy is present at 3.5kHz.

Footnote 1: The Alpha P5 offers a more even on-axis response than the original Alpha.
Fig.1 PSB Alpha P5, electrical impedance (solid) and phase (dashed) (2 ohms/vertical div.).
Another small discontinuity just above 400Hz in the impedance traces suggests some sort of resonance in that region. When I investigated the enclosure's vibrational behavior with a plastic-tape accelerometer, I found a high-level mode at 438Hz on the side-walls (fig.2), as well as on the back and top panels. This mode has a high Q, meaning that it takes a while to be fully excited and possibly lead to audible congestion in the midrange.
Fig.2 PSB Alpha P5, cumulative spectral-decay plot calculated from output of accelerometer fastened to center of sidewall (MLS driving voltage to speaker, 7.55V; measurement bandwidth, 2kHz).
The impedance-magnitude plot has a saddle centered on 53Hz, which implies that this is the port's tuning frequency. The blue trace in fig.3 shows the woofer's nearfield response, which has its minimum-motion notch at 53Hz. (This is the frequency at which the back pressure from the port resonance holds the cone stationary.) The nearfield response of the port (red trace) peaks at the same frequency; while its upper-frequency rolloff is clean, there is a significant peak at 800Hz. The black trace below 300Hz in fig.3 shows the sum of the nearfield woofer and port outputs, taking into account acoustic phase and the different distance of each radiator from a nominal farfield microphone position. The rise in response in the upper bass is due in part to the nearfield measurement technique.
Fig.3 PSB Alpha P5, anechoic response on woofer axis at 50", averaged across 30° horizontal window and corrected for microphone response, with nearfield woofer (blue) and port (red) responses and their complex sum respectively plotted below 300Hz, 480Hz, and 300Hz.
Fig.4 PSB Alpha P5, lateral response family at 50", normalized to response on woofer axis, from back to front: differences in response 90–5° off axis, reference response, differences in response 5–90° off axis.
Fig.5 PSB Alpha P5, vertical response family at 50", normalized to response on woofer axis, from back to front: differences in response 45–5° above axis, reference response, differences in response 5–45° below axis.
Fig.6 PSB Alpha P5, spatially averaged, 1/6-octave response in JA's listening room (red), with that of the Rogers LS3/5a (blue) and of the KEF LS50 (green).
The in-room response of all three speakers is shelved down a little in the midrange, with a similar rolloff below 100Hz disturbed by a small peak at 32Hz, the frequency of the lowest mode in my room. The PSBs excite this mode a little more than the KEFs and LS3/5a's, however. The KEFs and PSBs have very similar responses from 1kHz to 15kHz, with the slightly sloped-down output due to the increased absorptivity of the room's furnishings as the frequency rises. By contrast, the LS3/5a's have too much energy in-room in the top two audio octaves, as well as that characteristic bump just below 1.5kHz. As expected from the quasi-anechoic response in fig.3, the Alpha P5's in-room output drops like a stone above 17kHz, though it is fair to point out that that frequency lies above this 71-year-old's HF cutoff, which currently is just under 14kHz.
Fig.7 PSB Alpha P5, step response on woofer axis at 50" (5ms time window, 30kHz bandwidth).
Fig.8 PSB Alpha P5, cumulative spectral-decay plot on woofer axis at 50" (0.15ms risetime).
As I have come to expect from Paul Barton, the PSB Alpha P5 offers excellent measured performance, especially considering its affordable price.—John Atkinson
Footnote 1: The Alpha P5 offers a more even on-axis response than the original Alpha.


