Sidebar 3: Measurements
I used DRA Labs' MLSSA system and a calibrated DPA 4006 microphone to measure the PSB Synchrony T600's frequency response in the farfield. My reference axis for the measurements was level with the center of the midrange unit, which is 38" from the floor, slightly above the height of my ears in my listening chair. I used an Earthworks QTC-40 mike for the nearfield and in-room responses and Dayton Audio's DATS V2 system to measure the impedance.
PSB specifies the Synchrony T600's anechoic sensitivity as 89dB, presumably for 2.83V at 1m. My B-weighted estimate was slightly lower, at 87dB(B)/2.83V/m. The Synchrony T600's nominal impedance is specified as 4 ohms—also the specified minmum impedance. The solid trace in fig.1 indicates that the impedance magnitude lies between 4 and 6 ohms over most of the audioband, with minimum values of 3.26 ohms at 39Hz and 2.95 ohms between 117Hz and 124Hz. The electrical phase angle (dashed trace) is mostly low. However, the effective resistance, or EPDR (footnote 1), drops to 1.8 ohms at 35Hz, and to 2 ohms between 74Hz and 85Hz, and between 2.3kHz and 3.1kHz. The Synchrony T600 must be used with amplifiers that don't have problems driving 4 ohms. Fig.1 was taken with the loudspeaker's three reflex ports open. With them closed, the impedance was the same above 70Hz but now there is a single peak in the bass, centered on 46Hz (fig.2).


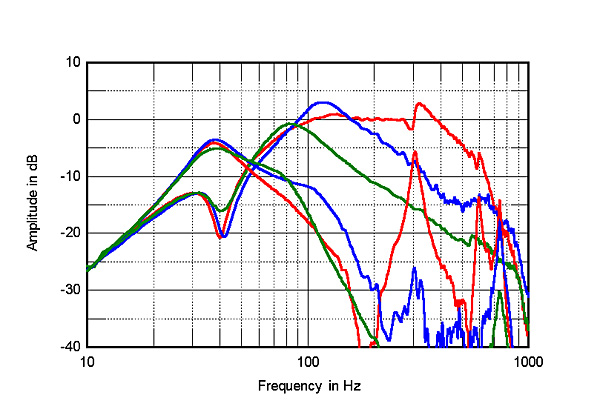
 The three woofers are each loaded with their own internal chambers and ports and behave differently. The complicated set of traces in fig.4 shows the nearfield outputs of the top woofer and port (red traces), of the middle woofer and port (blue traces), and of the bottom woofer and port (green traces). All three woofers have a minimum-motion notch close to 40Hz, which coincides with the tuning frequencies of the three ports. (This is a little higher in frequency than the tuning of the Image T3's ports, footnote 2.) The bottom woofer has the narrowest passband, rolling off above 90Hz with a second-order, 12dB/ octave slope. The middle woofer peaks around 120Hz and rolls off just above that frequency, again with a second-order slope. The output of the top woofer extends higher in frequency, up to the frequency where it crosses over to the midrange unit. A peak is visible at 740Hz in all three port outputs; two other peaks are present in the port that loads the top woofer, at 595Hz and 306Hz. The latter is sufficiently strong that it gives rise to a discontinuity in the nearfield output of its woofer. (If you look closely at the red traces in fig.4, you can see that woofer's output is the Hilbert transform of the port's output, where the port's peak coincides with the fastest rate of change in the woofer's output.)

 The Synchrony T600's farfield response, averaged across a 30° horizontal window centered on the midrange axis (fig.6, black trace above 300Hz), is even up to 15kHz with very slight dips balanced by equally small excesses of energy. Fig.6 was taken without the grille; repeating the measurement with the grille reduces the level between 6kHz and 9kHz by 2dB.
Fig.7 shows the Synchrony T600's horizontal dispersion normalized to the response on the midrange axis, which thus appears as a straight line. The contour lines in this graph are smooth and evenly spaced, behavior that correlates with the stable stereo imaging I noted in my auditioning. There is a slight off-axis flare at the bottom of the tweeter's passband, while a strong ridge of off-axis energy in the top audio octave reveals that the on-axis gulley in that region tends to fill in to the T600's sides. In the vertical plane (fig.8), the PSB's response doesn't change by much over a ±10° window centered on the midrange axis.
The Synchrony T600's farfield response, averaged across a 30° horizontal window centered on the midrange axis (fig.6, black trace above 300Hz), is even up to 15kHz with very slight dips balanced by equally small excesses of energy. Fig.6 was taken without the grille; repeating the measurement with the grille reduces the level between 6kHz and 9kHz by 2dB.
Fig.7 shows the Synchrony T600's horizontal dispersion normalized to the response on the midrange axis, which thus appears as a straight line. The contour lines in this graph are smooth and evenly spaced, behavior that correlates with the stable stereo imaging I noted in my auditioning. There is a slight off-axis flare at the bottom of the tweeter's passband, while a strong ridge of off-axis energy in the top audio octave reveals that the on-axis gulley in that region tends to fill in to the T600's sides. In the vertical plane (fig.8), the PSB's response doesn't change by much over a ±10° window centered on the midrange axis.
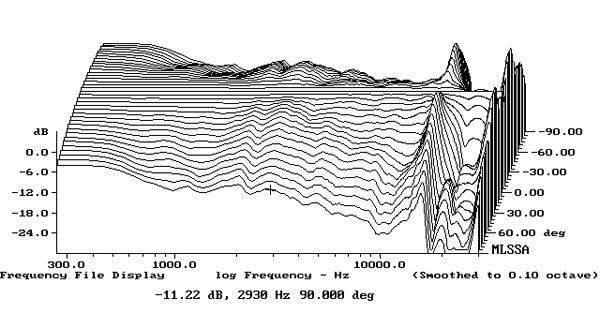

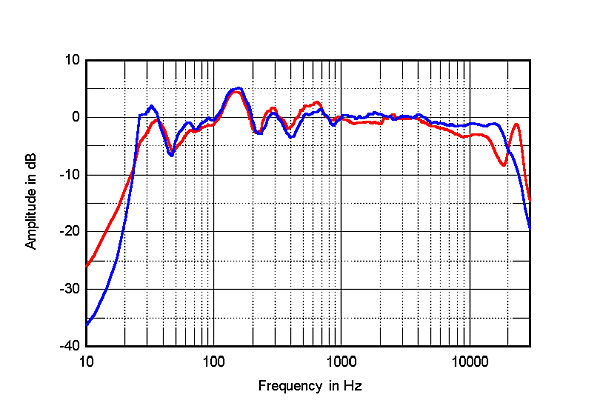
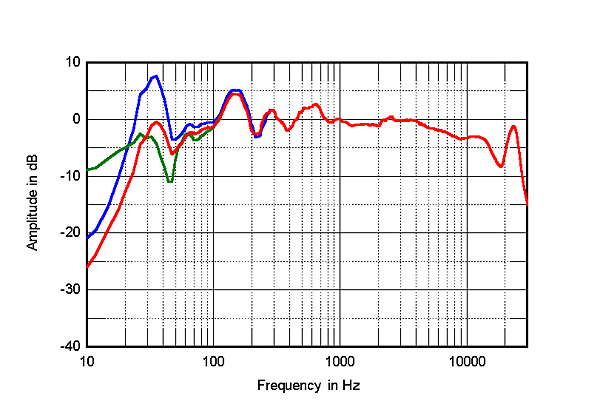 Fig.10 compares the Synchrony T600's spatially averaged response (red trace) with that of the similarly priced Canton Reference 7K that I reviewed in the September 2021 issue (blue trace, footnote 4). Both pairs of speakers have smooth, even in-room responses, though the PSBs have a little more upper-midrange energy than the Cantons. The Reference 7Ks have more top-octave output than the Synchrony T600s, as I discussed in my auditioning comments.

 Although I was puzzled by the presence of those port resonances, as I have come to expect from PSB, the Synchrony T600 offers excellent measured performance.—John Atkinson
Footnote 1: EPDR is the resistive load that gives rise to the same peak dissipation in an amplifier's output devices as the loudspeaker. See "Audio Power Amplifiers for Loudspeaker Loads," JAES, Vol.42 No.9, September 1994, and stereophile.com/reference/707heavy/index.html. Footnote 2: See fig.3 here. Footnote 3: Using the FuzzMeasure 3.0 program, a Metric Halo MIO2882 FireWire-connected audio interface, and a 96kHz sample rate, I average 20 1/6-octave–smoothed spectra, individually taken for the left and right speakers, in a rectangular grid 36" wide by 18" high and centered on the positions of my ears.
Footnote 4: The Canton Reference 7K costs $6995/pair.
Fig.1 PSB Synchrony T600 with ports open, electrical impedance (solid) and phase (dashed) (2 ohms/vertical div.).
Fig.2 PSB Synchrony T600 with ports blocked, electrical impedance (solid) and phase (dashed) (2 ohms/vertical div.).
The traces in figs.1 and 2 are free from the small discontinuities that would imply resonances of some kind. When I investigated the enclosure's vibrational behavior with a plastic-tape accelerometer, I found sidewalls that were relatively inert but with a couple of resonant modes on the back panel (fig.3). The highest-frequency mode, at 504Hz, was also present on the top panel. However, because this mode has a high Q (Quality Factor), I doubt that it will result in audible coloration. (The lower the Q of a resonance, the greater the possibility that it will be excited.)
Fig.3 PSB Synchrony T600, cumulative spectral-decay plot calculated from output of accelerometer fastened to center of back panel level with the tweeter (MLS driving voltage to speaker, 7.55V; measurement bandwidth, 2kHz).
Fig.4 PSB Synchrony T600, nearfield responses of top woofer and port (red), middle woofer and port (blue), and bottom woofer and port (green)
The sum of the three port outputs is shown as the blue trace in fig.5. It peaks at the tuning frequency in textbook fashion, but the upper-frequency rolloff is disturbed by the resonant peaks mentioned earlier. The red trace in fig.5 shows the sum of the woofer outputs with the ports open: It crosses over to the midrange unit's output (green trace) at the specified 450Hz with a clean high-frequency rolloff. The T600's farfield response on the midrange axis (green trace above 600Hz) is commendably even up to the top octave, where the tweeter's output starts to roll off below the ultrasonic metal-dome resonance at 22.7kHz.
Fig.5 PSB Synchrony T600, acoustic crossover on midrange axis at 50", corrected for microphone response, with the nearfield response of the midrange unit (green), the summed nearfield responses of the woofers (red), and the ports (blue), respectively plotted below 600Hz, 3.1kHz, and 800Hz.
The black trace below 300Hz in fig.6 is the complex sum of the PSB's nearfield woofer and port responses, with the latter's acoustic phase compensated for the fact that the ports are on the loudspeaker's back panel. The peak in the upper bass is due to the nearfield measurement technique. The red trace below 300Hz in fig.6 is the sum of the woofer outputs with all three ports blocked. It starts to roll off earlier than the output with the ports open but does so with a 12dB/octave slope instead of the reflex alignment's 24dB/octave slope. Both nearfield traces have the slight discontinuity at 300Hz due to the resonance in the top port's output. As the port is blocked with the red trace, this behavior must be due to an internal air-space mode rather than one associated with the port itself.
Fig.6 PSB Synchrony T600, anechoic response on midrange axis at 50", averaged across 30° horizontal window and corrected for microphone response, with the sum of the nearfield responses with ports open (black) and with ports blocked (red), both plotted below 300Hz.
Fig.7 PSB Synchrony T600, lateral response family at 50", normalized to response on midrange axis, from back to front: differences in response 90–5° off axis, reference response, differences in response 5–90° off axis.
Fig.8 PSB Synchrony T600, vertical response family at 50", normalized to response on midrange axis, from back to front: differences in response 15–5° above axis, reference response, differences in response 5–15° below axis.
Fig.9 shows the PSB Synchrony T600s' spatially averaged response in my room. (The spatial averaging (footnote 3) tends to average out the peaks and dips below 400Hz that are due to the room's resonant modes.) With the speakers' ports open (blue trace), the T600s maximally excite the lowest frequency mode just above 30Hz in my room, while with the ports blocked (green trace), the bass shelves down but is still relatively well-extended. With the speakers as I auditioned them—both top ports blocked and the right-hand speaker's bottom port blocked (red trace)—the peak at 32Hz is significantly reduced in level, but the octave above 50Hz is suppressed by a couple of dB. There is too much upper-bass energy in-room in all three conditions, but the balance at the listening position is generally even from 300Hz to 5kHz, though there is slightly too much energy between 500Hz and 800Hz. There is the usual gentle downward slope in the top two audio octaves. (A loudspeaker that offers a flat on-axis response and well-controlled lateral dispersion gives a gently sloped-down treble in the spatially averaged room response due to the increased absorption of the room's furnishings and the narrowing of the tweeter's radiation pattern at high frequencies.)
Fig.9 PSB Synchrony T600, spatially averaged, 1/6-octave response in JA's listening room with ports open (blue), ports blocked (green), and both top ports blocked and the right-hand bottom port blocked (red).
Fig.10 PSB Synchrony T600, spatially averaged, 1/6-octave response in JA's listening room (red) and of the Canton Reference 7K (blue).
Fig.11 PSB Synchrony T600, step response on midrange axis at 50" (5ms time window, 30kHz bandwidth).
Fig.12 PSB Synchrony T600, cumulative spectral-decay plot on midrange axis at 50" (0.15ms risetime).
Turning to the time domain, the Synchrony T600's step response on the midrange axis (fig.8) reveals that the tweeter, midrange unit, and woofers are all connected in positive acoustic polarity. The decay of the tweeter's step blends smoothly with the positive-going start of the midrange unit's step, and the decay of the midrange unit's step smoothly blends with the positive-going start of the woofers' step. This implies optimal crossover design. The Synchrony T600's cumulative spectral-decay plot (fig.10) is commendably clean.
Footnote 1: EPDR is the resistive load that gives rise to the same peak dissipation in an amplifier's output devices as the loudspeaker. See "Audio Power Amplifiers for Loudspeaker Loads," JAES, Vol.42 No.9, September 1994, and stereophile.com/reference/707heavy/index.html. Footnote 2: See fig.3 here. Footnote 3: Using the FuzzMeasure 3.0 program, a Metric Halo MIO2882 FireWire-connected audio interface, and a 96kHz sample rate, I average 20 1/6-octave–smoothed spectra, individually taken for the left and right speakers, in a rectangular grid 36" wide by 18" high and centered on the positions of my ears.


