Sidebar 3: Measurements
I used DRA Labs' MLSSA system and a calibrated DPA 4006 microphone to measure the Spendor A7's frequency response in the farfield, and an Earthworks QTC-40 mike for the nearfield responses. The Spendor's specified sensitivity is 88dB/2.83V/m; my estimate was close, at 87.1dB(B)/2.83V/m. The specified impedance is 8 ohms. Fig.1 shows that the A7's impedance magnitude (solid trace) remains above 8 ohms for the entire treble and most of the low bass. The minimum magnitude was a still-high 6.1 ohms at 228Hz, and while the electrical phase angle is sometimes high, this is always when the impedance is also high, mitigating any drive difficulty.

 The impedance-magnitude plot has the expected low-frequency saddle indicating the tuning of the port. The blue trace in fig.3 shows the woofer's nearfield response—it has a minimum-motion notch at 39Hz, which is when the back pressure from the port resonance holds the cone stationary. The ports' nearfield response (red trace) peaks slightly higher in frequency, and its upper-frequency rolloff is disturbed not only by three resonances in the midrange but also by a strong peak at 171Hz, this coincident with the impedance peak noted earlier. This mode is both strong and out of phase with the woofer's output—when I calculated the complex sum of the woofer and port responses in the ratio of their radiating areas, taking into account their different distances from a nominal farfield microphone position, there was a major notch centered on 171Hz. I suspect that, with the A7's woofer mounted close to the top of the baffle and the port at the base of the speaker's rear panel, there is some sort of organ-pipe resonance at this frequency. Ken Micallef didn't note any congestion in the upper bass; in fact, he was impressed by the solidity of the A7's bass and low-frequency extension. But this behavior might have been a reason he at first had some trouble sorting out the best positions for the Spendors in his room.


Fig.1 Spendor A7, electrical impedance (solid) and phase (dashed) (2 ohms/vertical div.).
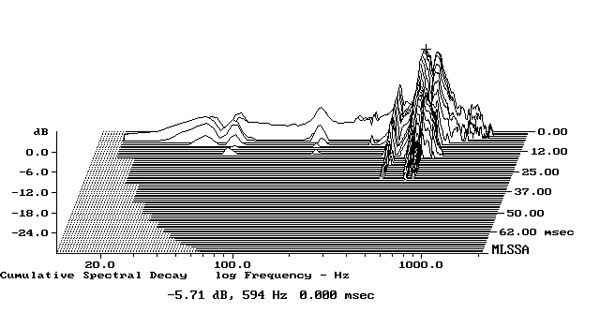
There is a small peak between 100 and 200Hz in the impedance-magnitude trace, but I found no enclosure problem in that region when I investigated the panels' vibrational behavior with a plastic-tape accelerometer. I did find some resonant modes on the sidewalls, the front baffle, and the rear panel. However, these were all relatively low in level, and the most significant modes—on the sidewalls, 12" from the base (fig.2)—were high enough in frequency and Quality factor (Q) to have no audible consequences.
Fig.2 Spendor A7, cumulative spectral-decay plot calculated from output of accelerometer fastened to center of sidewall 12" from the floor (MLS driving voltage to speaker, 7.55V; measurement bandwidth, 2kHz).
Fig.3 Spendor A7, anechoic response on tweeter axis at 50", averaged across 30° horizontal window and corrected for microphone response, with the nearfield woofer (blue) and port (red) responses and their complex sum (black), respectively plotted below 300Hz, 1kHz, and 300Hz.
Higher in frequency in fig.3, the black trace shows the Spendor's farfield response, averaged across a 30° horizontal window centered on the tweeter axis. It is impressively flat, with small peaks balanced by equally small dips. The plot of the A7's horizontal dispersion (fig.4) indicates that the speaker becomes relatively directional at the top of the woofer's passband, with then a slight off-axis flare in the bottom octave of the tweeter's passband. This behavior might lend the balance a touch of brightness in small and/or underdamped rooms—perhaps it correlates with KM's "touch of treble zing! in strings and guitars." In the vertical plane (fig.5), a sharply defined suckout at 3.9kHz develops 10° above the tweeter axis, confirming the specified crossover frequency of 3.7kHz. With the speaker on spikes, the tweeter is a low 34.5" above the floor; listeners should not sit too high.
Fig.4 Spendor A7, lateral response family at 50", normalized to response on tweeter axis, from back to front: differences in response 90–5° off axis, reference response, differences in response 5–90° off axis.
Fig.5 Spendor A7, vertical response family at 50", normalized to response on tweeter axis, from back to front: differences in response 15–5° above axis, reference response, differences in response 5–10° below axis.
Turning to the time domain, the A7's step response (fig.6) indicates that its tweeter is connected in inverted acoustic polarity, the woofer in positive polarity. This is a "very English" step response: the tweeter's step has almost fully decayed by the time the woofer's step arrives at the mike. (Ever since the BBC's classic LS3/5a of the mid-1970s, many British two-way speakers have had similar step responses.) The Spendor's cumulative spectral-decay plot (fig.7) was generally clean, though with some low-level delayed energy at the top of the woofer's passband.
Fig.6 Spendor A7, step response on tweeter axis at 50" (5ms time window, 30kHz bandwidth).
Fig.7 Spendor A7, cumulative spectral-decay plot on tweeter axis at 50" (0.15ms risetime).
Other than that peculiar port resonance mode, the A7 offers good measured performance, as I have come to expect from Spendor and its team of managing director Philip Swift and the company's Technical Design Manager Terry Miles.—John Atkinson