Sidebar 3: Measurements
I measured the Tannoy Revolution XT 6's farfield behavior with DRA Labs' MLSSA system and a calibrated DPA 4006 microphone. I used an Earthworks QTC-40 mike for the speaker's nearfield responses. Tannoy specifies the Revolution XT 6's sensitivity as "89dB," which I assume is for 1W at 1m. My estimate was 88.8dB(B)/2.83V/m, which is both within the margin of error and a little higher than average. Props to Tannoy for an honest sensitivity specification.
Although the Revolution XT 6's nominal impedance is specified as 8 ohms, the magnitude (fig.1, solid trace) is greater than 8 ohms throughout the treble. The impedance magnitude drops below 8 ohms in the midrange, with a minimum value of 5 ohms between 185Hz and 230Hz. The electrical phase angle (dashed trace) is generally benign, as when it has a high value, the magnitude is also high, reducing the speaker's demand for current from the partnering amplifier. The shape of the magnitude trace in this graph, with a value of 12 ohms and above in the treble but averaging 7 ohms in the midrange, suggests that the XT 6's treble will be exaggerated with tube amplifiers that have high output impedances.


 The XT 6's manual specifies the crossover frequency between the woofer and tweeter as 1.8kHz; this is corroborated by fig.3. (The tweeter's output is the green trace.) The woofer's upper-frequency rolloff is disturbed by a series of high-Q resonant peaks, and the tweeter appears to be balanced between 3dB and 5dB too high in level. (Bearing in mind my earlier comment about the shape of the impedance curve potentially exaggerating the XT 6's treble, I took these quasi-anechoic measurements using a Krell KSA-50 amplifier, which has an output impedance of 0.13 ohms; the effect of this low output impedance on the frequency response will be minimal.) Note also the pattern of narrow peaks and dips in the tweeter's output. I suspect these are interference effects due to the concentrically mounted tweeter's symmetrical acoustic environment. They should not affect sound quality.
The black trace below 300Hz in fig.4 shows the sum of the Tannoy's nearfield woofer and port outputs, taking into account acoustic phase and the different distance of each radiator from a nominal farfield microphone position. The excess of upper-bass energy will be due to the nearfield measurement technique, which assumes the radiators are mounted on a baffle that extends to infinity in both horizontal and vertical planes. The XT 6's reflex alignment appears to be tuned to be maximally flat, in textbook fashion.
The XT 6's manual specifies the crossover frequency between the woofer and tweeter as 1.8kHz; this is corroborated by fig.3. (The tweeter's output is the green trace.) The woofer's upper-frequency rolloff is disturbed by a series of high-Q resonant peaks, and the tweeter appears to be balanced between 3dB and 5dB too high in level. (Bearing in mind my earlier comment about the shape of the impedance curve potentially exaggerating the XT 6's treble, I took these quasi-anechoic measurements using a Krell KSA-50 amplifier, which has an output impedance of 0.13 ohms; the effect of this low output impedance on the frequency response will be minimal.) Note also the pattern of narrow peaks and dips in the tweeter's output. I suspect these are interference effects due to the concentrically mounted tweeter's symmetrical acoustic environment. They should not affect sound quality.
The black trace below 300Hz in fig.4 shows the sum of the Tannoy's nearfield woofer and port outputs, taking into account acoustic phase and the different distance of each radiator from a nominal farfield microphone position. The excess of upper-bass energy will be due to the nearfield measurement technique, which assumes the radiators are mounted on a baffle that extends to infinity in both horizontal and vertical planes. The XT 6's reflex alignment appears to be tuned to be maximally flat, in textbook fashion.
 The Tannoy XT 6's farfield response, averaged across a 30¯ horizontal window centered on the tweeter axis, is shown as the black trace above 300Hz in fig.4. The midrange is flat, but the region covered by the tweeter is too high in level, and a significant peak is visible between 2kHz and 3kHz. (This measurement was made without the vestigial grille; repeating it with the grille in place didn't change the response to any significant degree.) In an email, Herb did note that there was excess energy at "about 2.2kHz."
The plot of the Revolution XT 6's dispersion in the horizontal plane, referenced to the response on the tweeter axis, is shown in fig.5. The contour lines in this graph are relatively even up to 10kHz, which, all things being equal, will correlate with stable stereo imaging. However, as can be seen in fig.6, which shows the actual responses to the speaker's sides, the peak between 2kHz and 3kHz in the on-axis output continues all the way to 90° off-axis. In the vertical plane (fig.7), the XT 6 maintains its on-axis response over a wide window.
The Tannoy XT 6's farfield response, averaged across a 30¯ horizontal window centered on the tweeter axis, is shown as the black trace above 300Hz in fig.4. The midrange is flat, but the region covered by the tweeter is too high in level, and a significant peak is visible between 2kHz and 3kHz. (This measurement was made without the vestigial grille; repeating it with the grille in place didn't change the response to any significant degree.) In an email, Herb did note that there was excess energy at "about 2.2kHz."
The plot of the Revolution XT 6's dispersion in the horizontal plane, referenced to the response on the tweeter axis, is shown in fig.5. The contour lines in this graph are relatively even up to 10kHz, which, all things being equal, will correlate with stable stereo imaging. However, as can be seen in fig.6, which shows the actual responses to the speaker's sides, the peak between 2kHz and 3kHz in the on-axis output continues all the way to 90° off-axis. In the vertical plane (fig.7), the XT 6 maintains its on-axis response over a wide window.
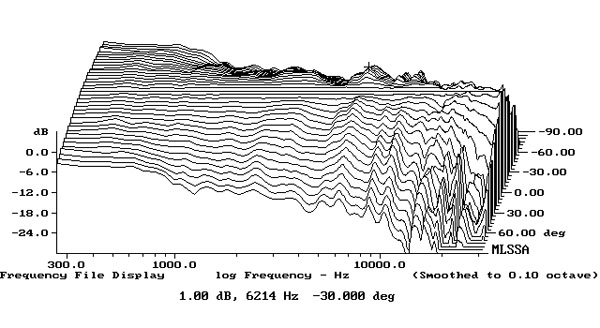

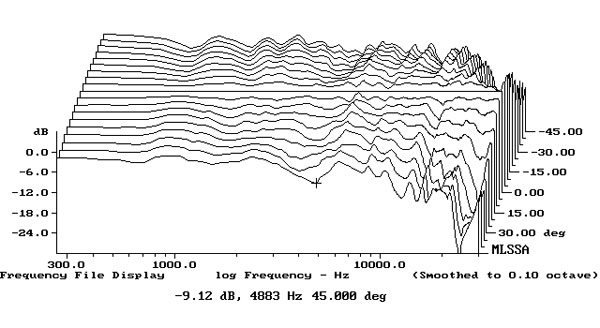
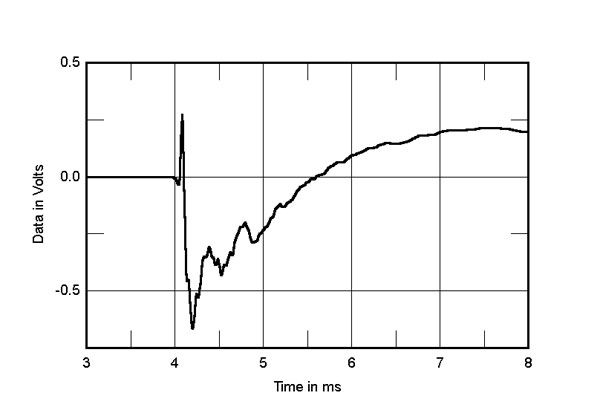

Fig.1 Tannoy Revolution XT 6, electrical impedance (solid) and phase (dashed) (2 ohms/vertical div.).
Slight discontinuities at 520Hz and 1400Hz in the traces in fig.1 imply the presence of panel resonances. However, when I investigated the enclosure's vibrational behavior with a plastic-tape accelerometer, the only modes I found on the sidewalls were lower in frequency, at 168Hz and 266Hz (fig.2), and were also low in level. The latter mode was stronger on the top panel; equally strong was a mode at 1400Hz, corresponding to the highest-frequency discontinuity in the impedance trace.
Fig.2 Tannoy Revolution XT 6, cumulative spectral-decay plot calculated from output of accelerometer fastened to center of sidewall (MLS driving voltage to speaker, 7.55V; measurement bandwidth, 2kHz).
The saddle between 50Hz and 60Hz in the impedance magnitude trace suggests that the tuning frequency of the Tannoy's downward-firing port lies in this region. This was confirmed by the fact that the nearfield response of the woofer (fig.3, blue trace) has its minimum-motion notch at 50Hz. (The back pressure from the port resonance holds the cone stationary at the tuning frequency.) The nearfield response of the port (red trace) peaks broadly between 40Hz and 80Hz with a generally clean upper-frequency rolloff.
Fig.3 Tannoy Revolution XT 6, acoustic crossover on tweeter axis at 50", corrected for microphone response, with the nearfield responses of the woofer (blue) and port (red), respectively plotted below 350Hz and 1kHz.
Fig.4 Tannoy Revolution XT 6, anechoic response on tweeter axis at 50", averaged across 30° horizontal window and corrected for microphone response (black), with the complex sum of the nearfield woofer and port responses plotted below 300Hz.
Fig.5 Tannoy Revolution XT 6, lateral response family at 50", normalized to response on tweeter axis, from back to front: differences in response 90–5° off axis, reference response, differences in response 5–90° off axis.
Fig.6 Tannoy Revolution XT 6, lateral response family at 50", from back to front: responses 90–5° off axis, on-axis response, responses 5–90° off axis.
Fig.7 Tannoy Revolution XT 6, vertical response family at 50", normalized to response on tweeter axis, from back to front: differences in response 45–5° above axis, reference response, differences in response 5–45° below axis.
In the time domain, the Tannoy XT 6's step response on the tweeter axis (fig.8) indicates that the concentric tweeter is connected in positive acoustic polarity, the woofer in inverted polarity. The decay of the woofer's step is overlaid with regular undulations, which correlates with two strong ridges of delayed energy between 2kHz and 3kHz in the Tannoy's cumulative spectral-decay plot (fig.9). I suspect that this behavior is due to break-up modes in the woofer's paper cone that have not been suppressed by the second-order low-pass filter used in the crossover. The decay in the midrange is clean, though other lower-level ridges are apparent throughout the treble.
Fig.8 Tannoy Revolution XT 6, step response on tweeter axis at 50" (5ms time window, 30kHz bandwidth).
Fig.9 Tannoy Revolution XT 6, cumulative spectral-decay plot on tweeter axis at 50" (0.15ms risetime).
While there were some good aspects to the Tannoy Revolution XT 6's measured performance—the higher-than-average sensitivity, the easy-to-drive impedance, the optimally tuned low-frequency alignment, and the clean, even midrange output—I was bothered by the excess of energy in the presence region, which I could hear with the MLSSA pseudorandom noise signal when I was performing the measurements.—John Atkinson


