Sidebar 4: Amplifier Measurements
I performed a full suite of measurements on one of the Vandersteen M5-HPA amplifiers (serial no.0138), using my Audio Precision SYS2722 system (see www.ap.com and the January 2008 "As We See It"). I usually precondition a power amplifier by running it at one-third the specified power into 8 ohms for 60 minutes. However, the M5-HPA turned itself off after 30 minutes. At that time, the side panels next to the heatsinks were hot, at 118.2°F (48.2°C), while the top panel was only slightly cooler, at 110.9°F (43.9°C). I waited a few minutes then turned the amplifier back on to continue the testing.
The Vandersteen's voltage gain at 1kHz into 8 ohms was 24.3dB, and the amplifier preserved absolute polarity (ie, was noninverting). (The input XLR is wired with pin 2 hot.) The input impedance was high, ranging from 181k ohms at 20Hz to 198k ohms at 1kHz and 146k ohms at 20kHz. The output impedance was a little higher than usual for a design with a solid-state output stage, at 0.5 ohm at 20Hz, 0.33 ohm at 1kHz, and 0.34 ohm at 20kHz. This impedance resulted in a response variation of ±0.25dB into our standard simulated loudspeaker (fig.1, gray trace). This graph reveals the high-pass function, with a –3dB point at 100Hz as set at the factory and an ultimate 6dB/ octave rolloff, which resulted in the expected sloped tops and bottoms with a 1kHz squarewave (fig.2). At the other end of the spectrum, the M5-HPA's response extended to –1.75dB at 200kHz into 8 ohms (fig.1, blue trace), which correlates with the excellent shape of a 10kHz squarewave (fig.3). Fig.4 shows the M5-HPA's response with the high-pass frequency set to all the frequencies possible. In each case the –3dB frequency corresponds to that set by the internal switch.

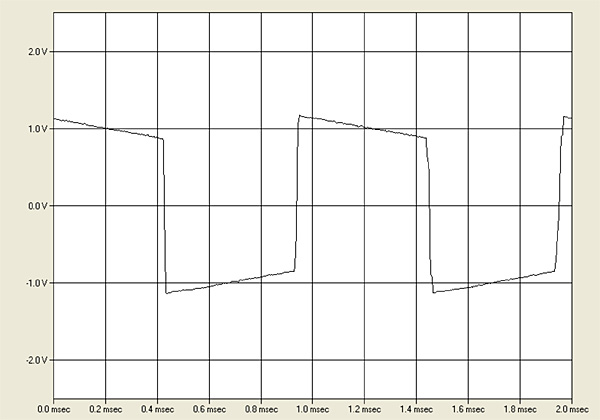


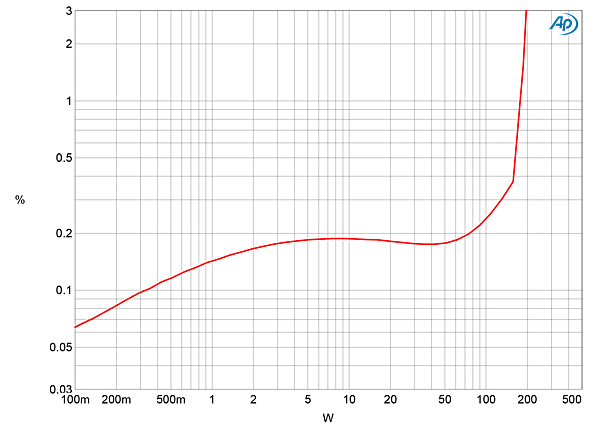

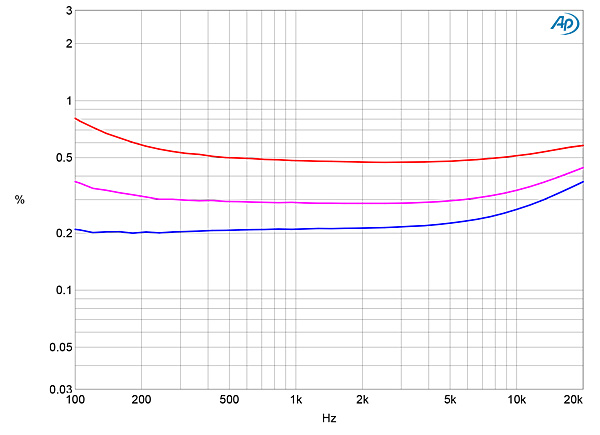
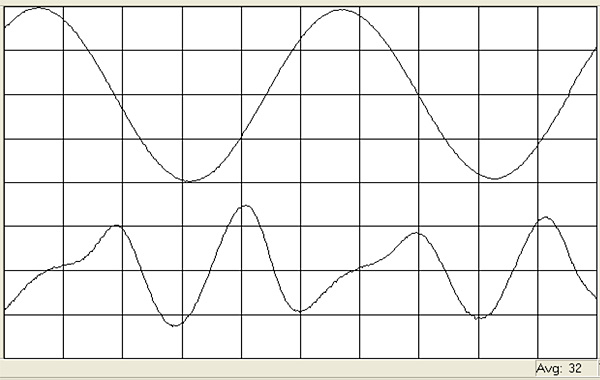
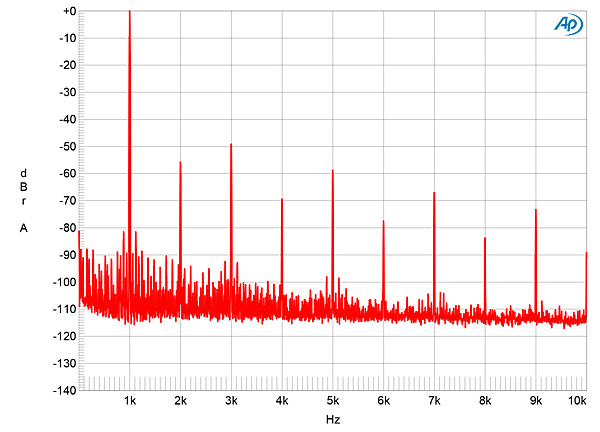
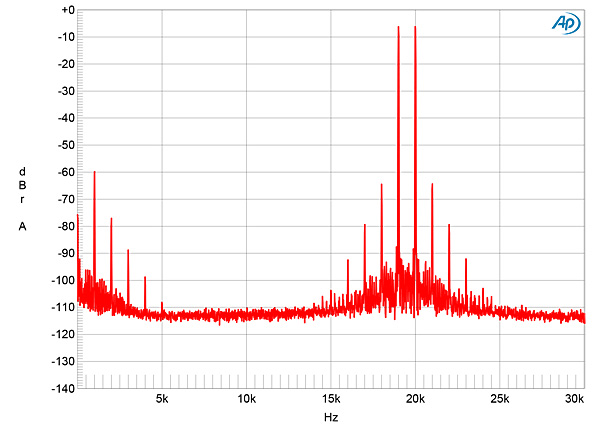
Fig.1 Vandersteen M5-HPA, frequency response at 2.83V into: simulated loudspeaker load (gray), 8 ohms (blue), 4 ohms (magenta), 2 ohms (red) (1dB/vertical div.).
Fig.2 Vandersteen M5-HPA, small-signal 1kHz squarewave into 8 ohms.
Fig.3 Vandersteen M5-HPA, small-signal 10kHz squarewave into 8 ohms.
Fig.4 Vandersteen M5-HPA, frequency response at 2.83V into 8 ohms with high-pass frequency set to 20Hz (red), 40Hz (magenta), 80Hz (green), 100Hz, (blue), and 200Hz (black).
The M5-HPA was significantly quieter than the M7-HPA, the unweighted, wideband signal/noise ratio (ref. 2.83V into 8 ohms and taken with the input shorted to ground) measuring 82.5dB, which improved to 98.7dB when the measurement bandwidth was restricted to the audioband, and to 101.7dB when A-weighted.
Figs. 5 and 6 plot the THD+noise percentage against power into 8 and 4 ohms. In both graphs, the THD+N rises from a low level at 100mW, plateauing at a moderate level between a few watts and several tens of watts. The M5-HPA exceeded its specified maximum output powers of 150W into 8 ohms and 300W into 4 ohms (both equivalent to 21.8dBW). Defining clipping as when the THD+N reaches 1%, the M5-HPA clipped at 172W into 8 ohms (22.35dBW) and at 315W into 4 ohms (22.0dBW). I plotted how the THD+N changed with frequency at a level where the percentage had plateaued in figs.5 and 6, 5.7V, which is equivalent to 4W into 8 ohms (fig.7, blue trace), 8W into 4 ohms (magenta), and 16W into 2 ohms (red). As I usually find, the distortion was higher into low impedances, but it only rose slightly at the top of the audioband. The increase in THD below 300Hz is presumably due to the amplifier's high-pass function.
Fig.5 Vandersteen M5-HPA, distortion (%) vs 1kHz continuous output power into 8 ohms.
Fig.6 Vandersteen M5-HPA, distortion (%) vs 1kHz continuous output power into 4 ohms.
Fig.7 Vandersteen M5-HPA, THD+N (%) vs frequency at 5.7V into: 8 ohms (blue), 4 ohms (magenta), 2 ohms (red).
The amplifier's distortion was predominantly the subjectively benign second and third harmonics (figs.8 and 9). Fig.10 shows the spectral analysis of the M5-HPA's output as it drove an equal mix of 19 and 20kHz tones at 4W into 8 ohms. The difference product at 1kHz lies at –60dB (0.1%), with higher-order spuriae visible at lower levels.
Fig.8 Vandersteen M5-HPA, 1kHz waveform at 4W into 8 ohms, 0.183% THD+N (top); distortion and noise waveform with fundamental notched out (bottom, not to scale).
Fig.9 Vandersteen M5-HPA, spectrum of 1kHz sinewave, DC–10kHz, at 8W into 4 ohms (linear frequency scale).
Fig.10 Vandersteen M5-HPA, HF intermodulation spectrum, DC–30kHz, 19+20kHz at 4W peak into 8 ohms (linear frequency scale).
The M5-HPA's distortion is both a little higher than that of the tube/solid-state M7-HPA and higher than I was expecting to see, given my positive reaction during my auditioning. However, the harmonic signature of that distortion and its level don't change over quite a wide range of frequencies and powers. I suspect that this is more important than the absolute level of distortion, provided it is not too high and doesn't lead to audible levels of intermodulation distortion.—John Atkinson


