Sidebar 3: Measurements
With Jason Victor Serinus's listening room 2900 miles from my home, measuring the Wilson Alexia V presented potential logistical problems. Fortunately, Elliot Fishkin of Manhattan audio retailer Innovative Audio was amenable to my measuring the Alexia Vs that had just been installed in one of their listening rooms. (Thanks, Elliot.)
As I was traveling from Brooklyn to Innovative on the New York subway, I used the Fuzzmeasure app installed on my Mac mini for the acoustic measurements rather than the bulky 1997-vintage PC that I use with DRA Labs' MLSSA system. The microphone was a calibrated Earthworks QTC-40. Preamplification, D/A conversion, and A/D conversion were performed by a Metric Halo 2882 FireWire interface. The amplifiers used for the testing were Dan D'Agostino Momentum MxV monoblocks.
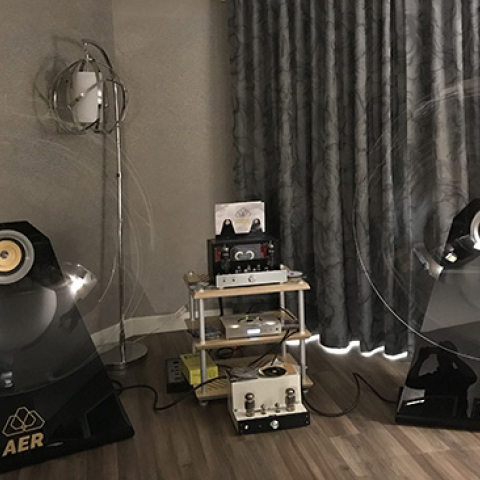
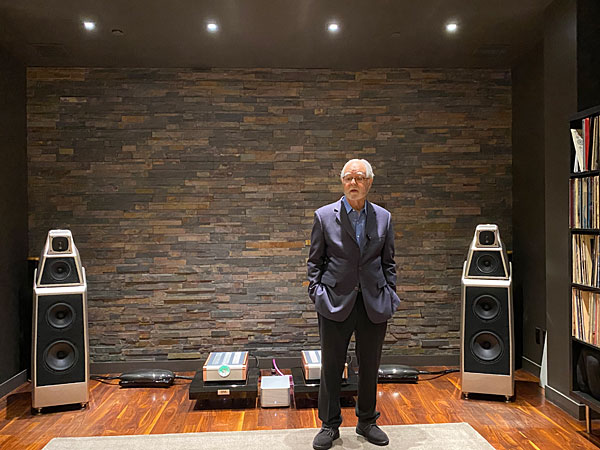 For the spatially averaged in-room response measurements, I left the speakers in the positions where Wilson's Peter McGrath and Innovative Audio's Chris Forman had set them up for the previous weekend's demonstrations (see photo). For the quasi-anechoic response measurements, Chris carefully maneuvered the left-hand Alexia V, serial number 0023, several feet away from its corner location so that it was aimed along the room's diagonal. (Thanks, Chris.) As the Wilson speaker weighs 265lb, we weren't able to lift it off the floor to move the early reflections further back in time. However, I felt that if I performed the measurements at 1m rather than my usual 50", the FFT-calculated response would have sufficient resolution in the midrange.
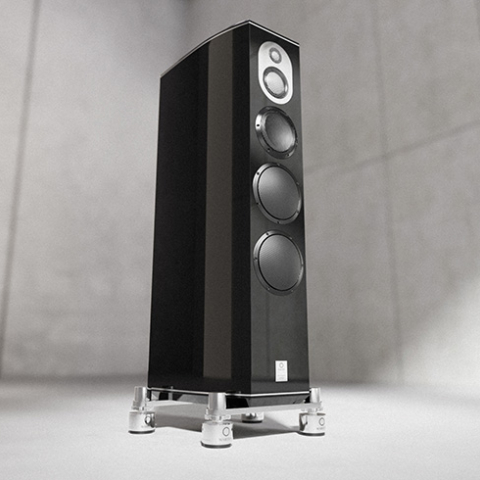
Wilson specifies the Alexia V's sensitivity as 90dB/W/m, which is the same as that of the original Alexia and the Alexia 2. My estimate was 91.8dB/2.83V/m; note the different units. As the Alexia V's nominal impedance is specified as 4 ohms, the speaker will be drawing 2W from the amplifier with a signal of 2.83V. 2V is equivalent to 1W into 4 ohms, which means that if I adopt the dB/W/m units used by Wilson, my sensitivity estimate is numerically 3dB lower, at 88.8dB/W/m, slightly below the Wilson specification.
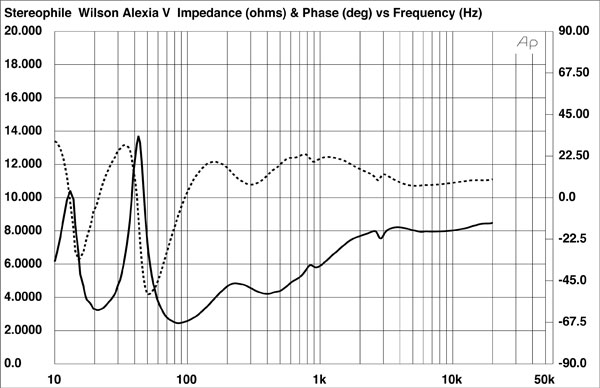
I used Dayton Audio's DATS V2 system to measure the Alexia V's impedance. The impedance magnitude (fig.1, solid trace) remains between 4 ohms and 8 ohms for almost the entire audioband. The minimum value was 2.45 ohms at 85Hz; Wilson says the minimum is 2.59 ohms, at 84Hz. The electrical phase angle (dotted trace) is high at low frequencies; the effective resistance (EPDR, footnote 1), which is calculated from the combination of magnitude and phase angle, is >3 ohms above 225Hz but drops below 2 ohms between 50Hz and 90Hz. The minimum EPDR is 1.15 ohms at 66Hz. The Alexia V is not as current-hungry as the earlier versions—the original Alexia's EPDR was below 1 ohm through most of the bass and midrange; that of the Alexia 2 lay below 2 ohms in the same regions, with the same minimum value at 65Hz—but the V still needs to be matched with amplifiers that won't be fazed by low impedances.
For the spatially averaged in-room response measurements, I left the speakers in the positions where Wilson's Peter McGrath and Innovative Audio's Chris Forman had set them up for the previous weekend's demonstrations (see photo). For the quasi-anechoic response measurements, Chris carefully maneuvered the left-hand Alexia V, serial number 0023, several feet away from its corner location so that it was aimed along the room's diagonal. (Thanks, Chris.) As the Wilson speaker weighs 265lb, we weren't able to lift it off the floor to move the early reflections further back in time. However, I felt that if I performed the measurements at 1m rather than my usual 50", the FFT-calculated response would have sufficient resolution in the midrange.
Wilson specifies the Alexia V's sensitivity as 90dB/W/m, which is the same as that of the original Alexia and the Alexia 2. My estimate was 91.8dB/2.83V/m; note the different units. As the Alexia V's nominal impedance is specified as 4 ohms, the speaker will be drawing 2W from the amplifier with a signal of 2.83V. 2V is equivalent to 1W into 4 ohms, which means that if I adopt the dB/W/m units used by Wilson, my sensitivity estimate is numerically 3dB lower, at 88.8dB/W/m, slightly below the Wilson specification.
I used Dayton Audio's DATS V2 system to measure the Alexia V's impedance. The impedance magnitude (fig.1, solid trace) remains between 4 ohms and 8 ohms for almost the entire audioband. The minimum value was 2.45 ohms at 85Hz; Wilson says the minimum is 2.59 ohms, at 84Hz. The electrical phase angle (dotted trace) is high at low frequencies; the effective resistance (EPDR, footnote 1), which is calculated from the combination of magnitude and phase angle, is >3 ohms above 225Hz but drops below 2 ohms between 50Hz and 90Hz. The minimum EPDR is 1.15 ohms at 66Hz. The Alexia V is not as current-hungry as the earlier versions—the original Alexia's EPDR was below 1 ohm through most of the bass and midrange; that of the Alexia 2 lay below 2 ohms in the same regions, with the same minimum value at 65Hz—but the V still needs to be matched with amplifiers that won't be fazed by low impedances.
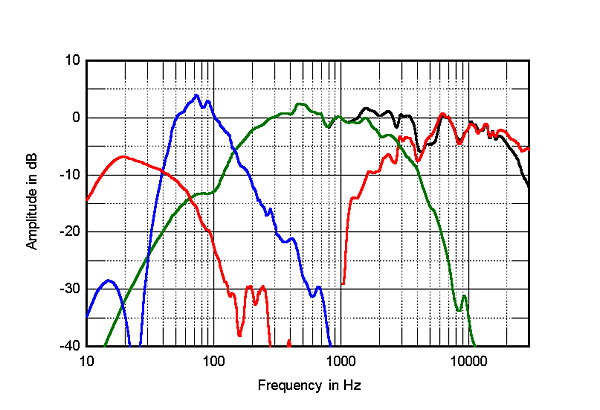 Chris Forman had told me that when the speakers were set up, the time alignment of the midrange units and tweeters had been optimized for an ear height of 38" at the front listening seat, which was 160" from each speaker. As the Alexia V's tweeter is 49" from the floor with the speaker on its spikes and I was going to measure the farfield behavior at 1m, I calculated that I should place the microphone 46" high, which would place it on the line joining the tweeter to a listener's ears. The green trace above 400Hz and the red trace above 1kHz in fig.2, respectively, show the farfield responses of the midrange unit and the tweeter on this axis, while the black trace shows their combined output averaged across a 30° horizontal angle.
The midrange/tweeter crossover appears to be set just below 3kHz and other than a narrow suckout between 4kHz and 6kHz, the response trend is relatively even. It is possible that the suckout is a result of the relatively close microphone distance, as it was not present in the spatially averaged response, which was taken at a 160" distance (see fig.3). The geometry of the Innovative listening room meant that it wasn't possible to move the microphone and its stand more than 15° to the side of the optimal axis to measure its behavior off-axis. (It wasn't feasible to take my bulky computer-controlled Outline turntable to Innovative for the measurements, even if we could have lifted the Alexia V onto it.) However, the tweeter starts to become relatively directional above 15kHz, which is why the black trace in fig.2 slopes down above that frequency compared with the tweeter's on-axis output (red trace). Repeating the 1m response measurement at different microphone heights indicated that a suckout develops in the crossover region above the optimal axis. The on-axis response is maintained up to 5° below that axis, however.
Chris Forman had told me that when the speakers were set up, the time alignment of the midrange units and tweeters had been optimized for an ear height of 38" at the front listening seat, which was 160" from each speaker. As the Alexia V's tweeter is 49" from the floor with the speaker on its spikes and I was going to measure the farfield behavior at 1m, I calculated that I should place the microphone 46" high, which would place it on the line joining the tweeter to a listener's ears. The green trace above 400Hz and the red trace above 1kHz in fig.2, respectively, show the farfield responses of the midrange unit and the tweeter on this axis, while the black trace shows their combined output averaged across a 30° horizontal angle.
The midrange/tweeter crossover appears to be set just below 3kHz and other than a narrow suckout between 4kHz and 6kHz, the response trend is relatively even. It is possible that the suckout is a result of the relatively close microphone distance, as it was not present in the spatially averaged response, which was taken at a 160" distance (see fig.3). The geometry of the Innovative listening room meant that it wasn't possible to move the microphone and its stand more than 15° to the side of the optimal axis to measure its behavior off-axis. (It wasn't feasible to take my bulky computer-controlled Outline turntable to Innovative for the measurements, even if we could have lifted the Alexia V onto it.) However, the tweeter starts to become relatively directional above 15kHz, which is why the black trace in fig.2 slopes down above that frequency compared with the tweeter's on-axis output (red trace). Repeating the 1m response measurement at different microphone heights indicated that a suckout develops in the crossover region above the optimal axis. The on-axis response is maintained up to 5° below that axis, however.
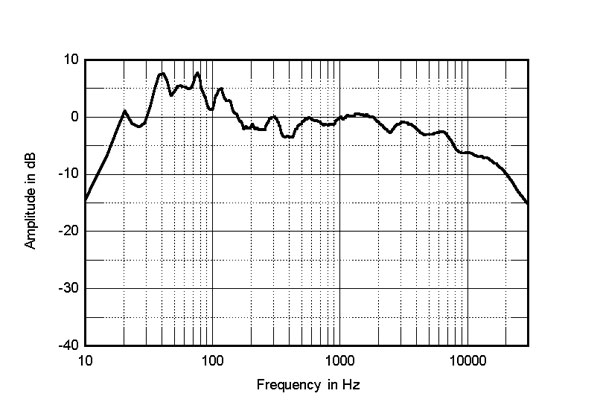 To examine the Wilson Alexia V's spatially averaged in-room response, I averaged 20 1/6 octave–smoothed spectra, taken for the left and right speakers individually, in a rectangular grid 36" wide by 18" high and centered on the center of the listening seat. The result is shown in fig.3. The response is even through the lower midrange to the mid-treble, with small dips balanced by small peaks. The usual gentle downward slope in the top two octaves is present; this will be due both to the increasing directivity of the tweeter in this region and to the high-frequency absorption of the room's furnishings. The upper- and mid-bass regions are elevated, which may well have been due to the speakers' corner placement. I could hear this when I listened to the music recordings being played by Peter McGrath at the press preview in this room, though the Alexia V's low frequencies were superbly well controlled.
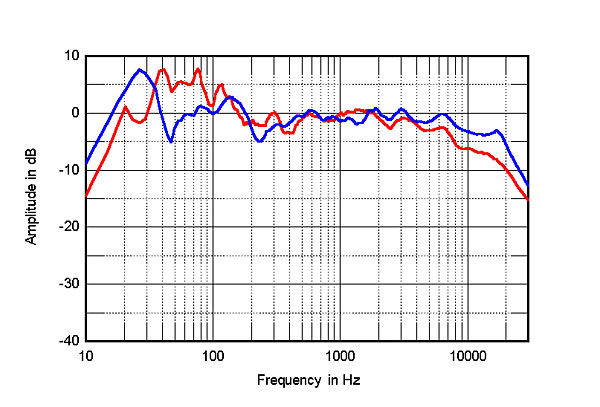
Although I had examined the spatially averaged response of the Wilson Alexandria XLF in Innovative's listening room in 2012 (footnote 2), the room has been significantly modified since then. I thought it more informative, therefore, to compare the Alexia V's spatially averaged response in Innovative's current room (fig.4, red trace) with that of the Alexia 2 in my room (blue trace). The Alexia 2s were positioned well away from the room corners, so the mid and upper bass were in good balance with the midrange. However, the lowest-frequency mode in my room was maximally excited. The Alexia V's midrange and low treble are more evenly balanced than those of the Alexia 2, though their greater distance from the listening position—160" vs 102"—means that the red trace slopes down above 5kHz to a greater extent than the blue trace.
To examine the Wilson Alexia V's spatially averaged in-room response, I averaged 20 1/6 octave–smoothed spectra, taken for the left and right speakers individually, in a rectangular grid 36" wide by 18" high and centered on the center of the listening seat. The result is shown in fig.3. The response is even through the lower midrange to the mid-treble, with small dips balanced by small peaks. The usual gentle downward slope in the top two octaves is present; this will be due both to the increasing directivity of the tweeter in this region and to the high-frequency absorption of the room's furnishings. The upper- and mid-bass regions are elevated, which may well have been due to the speakers' corner placement. I could hear this when I listened to the music recordings being played by Peter McGrath at the press preview in this room, though the Alexia V's low frequencies were superbly well controlled.
Although I had examined the spatially averaged response of the Wilson Alexandria XLF in Innovative's listening room in 2012 (footnote 2), the room has been significantly modified since then. I thought it more informative, therefore, to compare the Alexia V's spatially averaged response in Innovative's current room (fig.4, red trace) with that of the Alexia 2 in my room (blue trace). The Alexia 2s were positioned well away from the room corners, so the mid and upper bass were in good balance with the midrange. However, the lowest-frequency mode in my room was maximally excited. The Alexia V's midrange and low treble are more evenly balanced than those of the Alexia 2, though their greater distance from the listening position—160" vs 102"—means that the red trace slopes down above 5kHz to a greater extent than the blue trace.
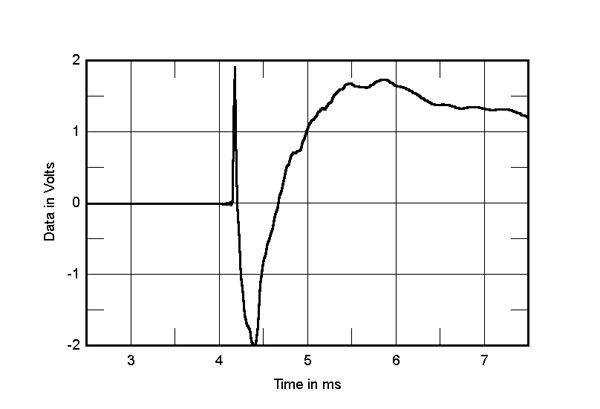
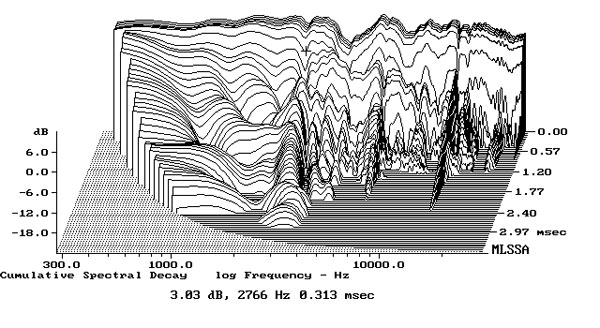
 In the time domain, the step response on the optimal axis at 1m (fig.5) reveals that the tweeter and woofers are connected in positive acoustic polarity, the midrange unit in negative polarity. (I confirmed this by looking at the individual step response of each unit.) The decay of the tweeter's step smoothly blends with the negative-going start of the midrange unit's step and the decay of the midrange unit's step blends almost as smoothly with the positive-going start of the woofers' step. This suggests optimal crossover implementation. Finally, the cumulative spectral-decay plot at 1m on the optimal axis (fig.6) shows a relatively clean initial decay but low-level ridges of delayed energy at 2.76kHz and 6.28kHz.
Footnote 1: EPDR is the resistive load that gives rise to the same peak dissipation in an amplifier's output devices as the loudspeaker. See "Audio Power Amplifiers for Loudspeaker Loads," JAES, Vol.42 No.9, September 1994, and stereophile.com/reference/707heavy/index.html. Footnote 2: See fig.7 here
Wilson Audio's Peter McGrath demonstrates the Alexia Vs in Innovative Audio's listening room. (Photo: John Atkinson)
Fig.1 Wilson Alexia V, electrical impedance (solid) and phase (dashed) (2 ohms/vertical div.).
The impedance traces are free from small wrinkles that would suggest the presence of cabinet resonances. I listened to the enclosures with a stethoscope while I played the half-step–spaced tonebursts from my Editor's Choice CD (Stereophile STPH016-2; no longer available). While I could hear some liveliness between 200Hz and 600Hz on the upper enclosure's sidewalls, this was low in level. The woofer enclosure seemed impressively inert.
The saddle centered at 21Hz in the impedance magnitude trace suggests that the port on the rear panel of the woofer enclosure is tuned to that frequency, which implies excellent low-frequency extension. (The Alexia and Alexia 2 had very similar port tunings.) The port's output, measured in the nearfield and plotted with its level scaled relative to that of the woofers' summed output in the ratio of the square roots of their radiating areas (fig.2, red trace below 300Hz), peaks between 10Hz and 60Hz, with a clean upper-frequency rolloff. The woofers' nearfield output (fig.2, blue trace) has a deep notch at the port tuning frequency then peaks between 50Hz and 100Hz, crossing over to the midrange unit (green trace) around 150Hz. (Again, this is very similar to the low-frequency nearfield behavior of the two earlier versions of the Alexia.)
Fig.2 Wilson Alexia V, anechoic response on optimal axis at 1m of the tweeter (red above 1kHz), the midrange unit (green above 800Hz), and of both units together averaged across 30° horizontal window (black), all corrected for microphone response, with the nearfield responses of the midrange unit (green), woofers (blue), and port (red) respectively plotted below 400Hz, 800Hz, and 300Hz.
Fig.3 Wilson Alexia V, spatially averaged, 1/6-octave response in Innovative Audio's listening room.
I compared the responses of both Alexia Vs at 1m on the optimal axis; the difference between the two responses lay within ±1.25dB from 300Hz to 20kHz, which is good pair matching.
Fig.4 Wilson Alexia V, spatially averaged, 1/6-octave response in Innovative Audio's listening room (red), and of Wilson Alexia 2 (blue) in JA's listening room.
Fig.5 Wilson Alexia V, step response on optimal axis at 1m (5ms time window, 30kHz bandwidth).
Fig.6 Wilson Alexia V, cumulative spectral-decay plot on optimal axis at 1m (0.15ms risetime).
Overall, the Wilson Alexia V's measured performance is very good, correlating with what I heard at Innovative. I was impressed by the uncompressed scale of the sound and the palpability and stability of the soundstaging in Peter McGrath's demonstration, as well as by the extended and superbly well-controlled low frequencies.—John Atkinson
Footnote 1: EPDR is the resistive load that gives rise to the same peak dissipation in an amplifier's output devices as the loudspeaker. See "Audio Power Amplifiers for Loudspeaker Loads," JAES, Vol.42 No.9, September 1994, and stereophile.com/reference/707heavy/index.html. Footnote 2: See fig.7 here