Sidebar 3: Measurements
I used my Audio Precision SYS2722 system to perform a complete set of measurements using the PMG Signature's balanced inputs and outputs. I used the menu on the front-panel touchscreen to make sure that AC Couple was turned off and the input gain trim controls were deactivated. (The display showed that the preamplifier's serial number was 5D0197 and its firmware was v.2.3.5.) I repeated some of the tests using the unbalanced RCA inputs and outputs, then did more tests with the magazine's higher-performance APx555.
With the Phase control set to Off, the PMG Signature preserved absolute polarity (ie, was noninverting) with the balanced and single-ended inputs and outputs. (Its XLR jacks are wired with pin 2 hot, the AES convention.) The volume control operated in accurate 0.5dB steps, and with this control set to the maximum of "100," the gain was 12.5dB for the balanced and single-ended inputs at both the balanced and unbalanced outputs. One of the single-ended inputs can be set to Fixed Volume, for use as a Home Theater Bypass. This input's gain can be adjusted with the menu: With the fixed volume set to "100," the gain was 12.5dB at both the balanced and unbalanced outputs; the "75" setting was unity gain at both output types.
Though different from the values specified on the PS Audio website, the PMG Signature's input impedances were still usefully high, at 39k ohms across the audioband for the balanced inputs and 26k ohms at 20Hz and 1kHz, 24k ohms at 20kHz, for the unbalanced inputs. The single-ended output impedance was a usefully low 100 ohms and the balanced output impedance was 390 ohms, both values consistent from 20Hz to 20kHz.
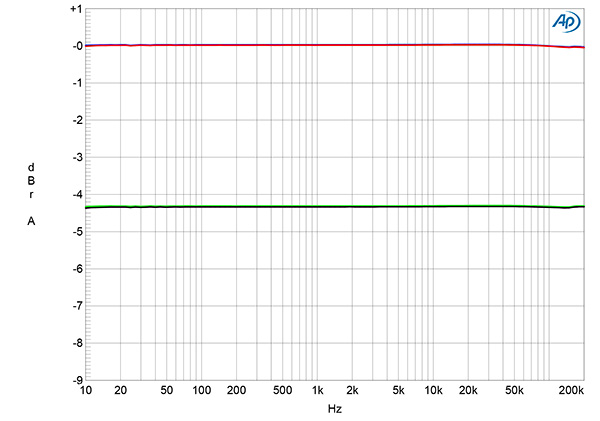
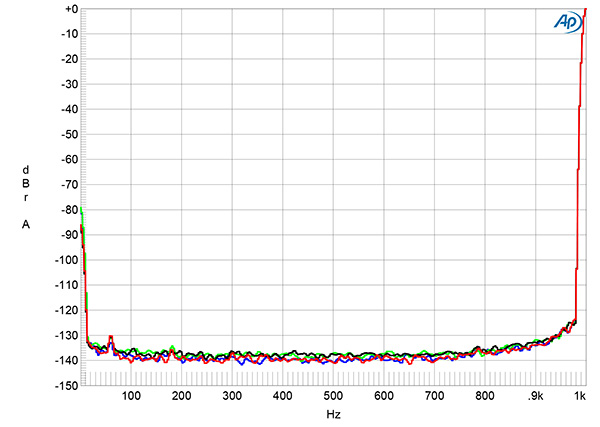
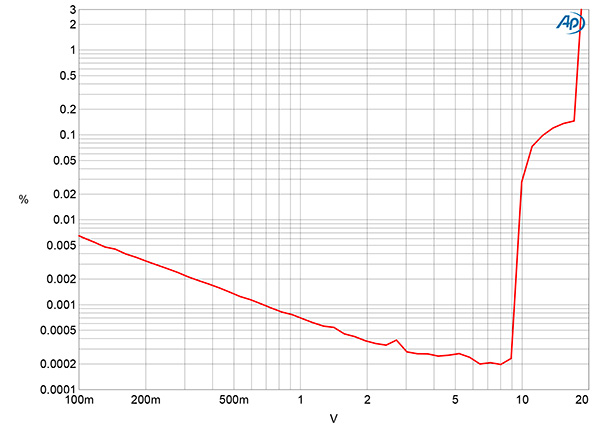
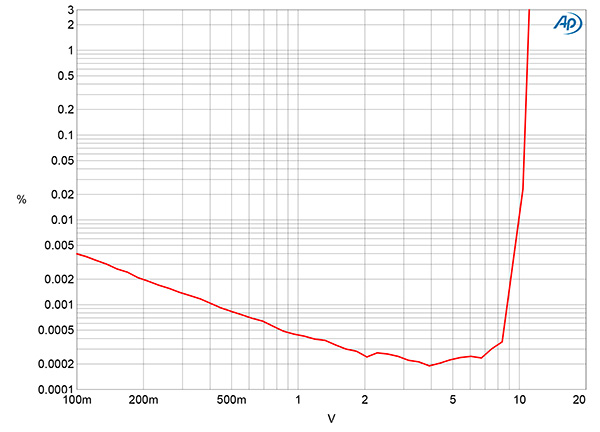
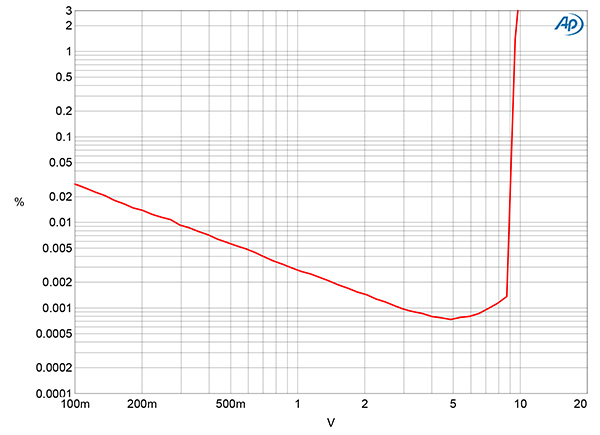
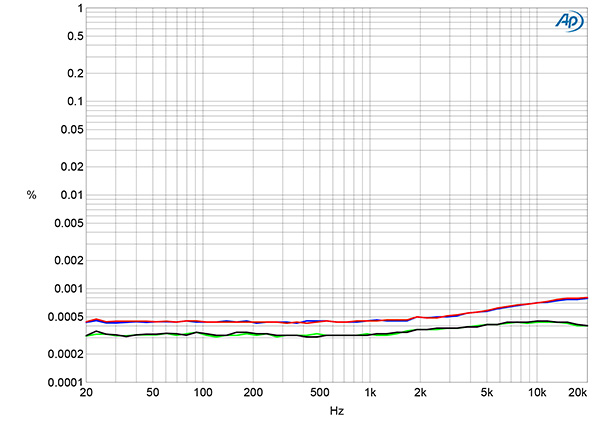
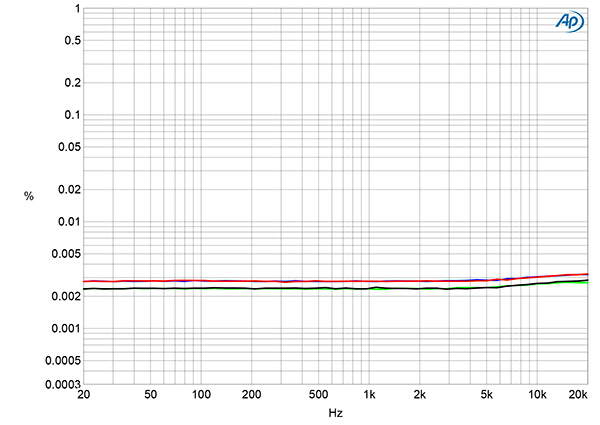
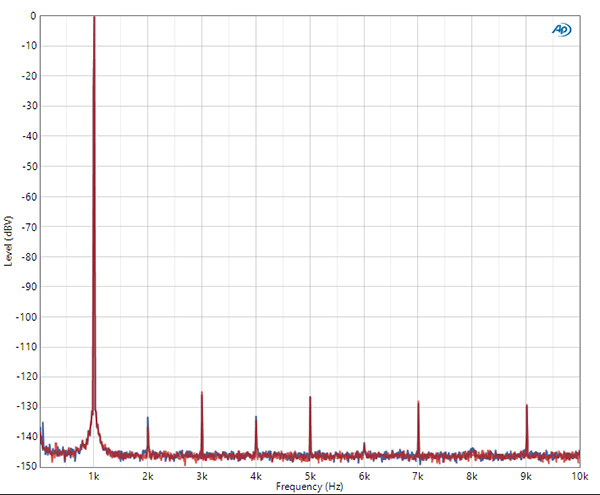
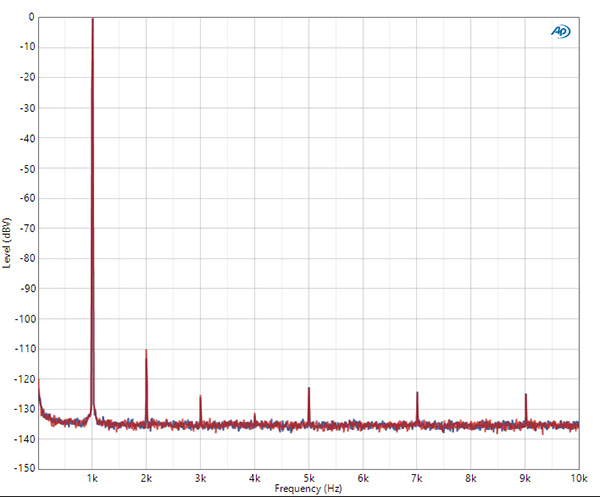
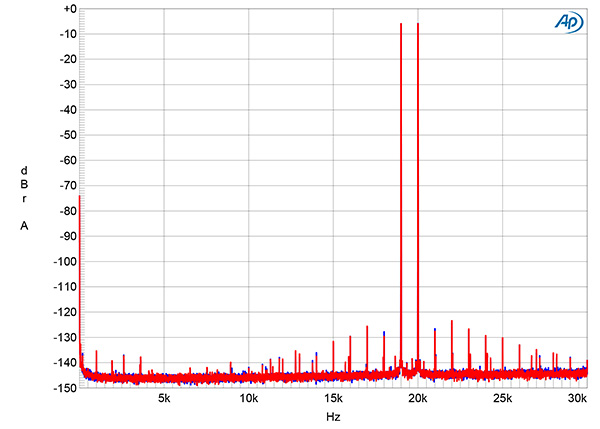
Fig.1 PS Audio PMG Signature, balanced frequency response with volume control set to "100" at 2V into: 100k ohms (left channel blue, right red), 600 ohms (left green, right gray) (1dB/vertical div.).
The preamplifier's balanced frequency response was flat from 10Hz to 200kHz into both 100k ohms (fig.1, blue and red traces) and 600 ohms (green and gray traces). Fig.1 was taken with the PMG Signature's volume control at its maximum setting. Both the frequency response and the superb channel matching were preserved at lower settings of the control and with the unbalanced inputs and outputs. The PS Audio preamp's channel separation was astonishingly high, at >130dB in both directions below 3kHz, and decreased only slightly at the top of the audioband.
Fig.2 PS Audio PMG Signature, balanced spectrum of 1kHz sinewave, DC–1kHz, at 2V into 100k ohms with volume control set to "100" (left channel blue, right red) and to –12dB (left green, right gray) (linear frequency scale; 20dB/vertical div.)
From balanced inputs to balanced outputs, the PMG Signature offered extremely low noise, with no power supply–related spuriae (fig.2). The blue and red traces in this graph were taken with the volume control set to the maximum. The levels of the noise components only rose a couple of dB when I repeated the spectral analysis with the control set to –12dB and the level of the input signal increased by 12dB so that the output level remained the same (gray, green traces). The wideband, unweighted signal/noise ratio, measured at the balanced outputs with the single-ended input shorted to ground but the volume control set to its maximum, was a very high 83.5dB ref. 2V in both channels. Restricting the measurement bandwidth to the audioband increased the S/N to a superb 96.7dB, while switching an A-weighting filter into circuit further improved this ratio, to 99.4dB.
Fig.3 PS Audio PMG Signature, balanced distortion (%) vs 1kHz output voltage into 100k ohms.
Fig.4 PS Audio PMG Signature, balanced distortion (%) vs 1kHz output voltage into 600 ohms.
Fig.5 PS Audio PMG Signature, unbalanced distortion (%) vs 1kHz output voltage into 100k ohms.
PS Audio specifies the maximum output level as 18V, balanced, and 9V, unbalanced. Fig.3 plots the percentage of THD+noise in the PMG Signature's balanced output against the output voltage into 100k ohms. With the clipping voltage defined as being when the THD+N reaches 1%, the balanced output clipped at the specified voltage into 100k ohms, though there is an odd discontinuity in the trace above 12V. This was absent when I examined how the THD+N changed into 600 ohms, when the clipping voltage was 10.5V (fig.4), and when I tested the clipping voltage from the unbalanced outputs into 100k ohms (fig.5; 1% THD+N at 9.4V).
Fig.6 PS Audio PMG Signature, balanced distortion (%) vs frequency at 4V into 100k ohms (left channel blue, right red) and 600 ohms (left green, right gray).
Fig.7 PS Audio PMG Signature, unbalanced distortion (%) vs frequency at 4V into 100k ohms (left channel blue, right red) and 600 ohms (left green, right gray).
The downward slope of the trace below 4V in fig.3 indicates that the actual distortion lies below the low noisefloor. To be sure that the reading was not dominated by noise, therefore, I measured how the distortion in the PMG Signature's balanced outputs changed with frequency at 4V into 100k ohms (fig.6, blue and red traces). Commendably, there was only a very slight increase in the THD+N in the top audio octaves and, unusually, the distortion was even lower at the same voltage into 600 ohms (green and gray traces). As expected from fig.5, when I repeated this test with the single-ended outputs, the THD+N was higher than from the balanced outputs but was still very low at 0.003% at all audio frequencies (fig.7).
Fig.8 PS Audio PMG Signature, balanced spectrum of 1kHz sinewave, DC–10kHz, at 3V into 200k ohms (left channel blue, right red; linear frequency scale; 10dB/vertical div.).
Fig.9 PS Audio PMG Signature, unbalanced spectrum of 1kHz sinewave, DC–10kHz, at 3V into 100k ohms (left channel blue, right red; linear frequency scale; 10dB/vertical div.).
The third harmonic was dominant in the balanced outputs (fig.8) but was negligible at –116dB (0.00015%). At the same voltage from the single-ended outputs (fig.9), the second harmonic was the highest in level at just –100dB (0.001%). The difference in the distortion signatures in the two output types is due to the fact that with a balanced output, even-order harmonics cancel if the positive and negative output circuits are perfectly matched. Tested for intermodulation distortion with an equal mix of 19kHz and 20kHz tones at a peak voltage of 4V, the second-order difference product at 1kHz lay at a vanishingly low –134dB (0.00002%) even into 600 ohms (fig.10)!
Fig.10 PS Audio PMG Signature, balanced HF intermodulation spectrum, DC–30kHz, 19+20kHz at 4V into 600 ohms (left channel blue, right red; linear frequency scale; 20dB/vertical div.).
No doubt about it, the PS Audio PMG Signature is one of the best-measuring preamplifiers I have had in my test lab, rivaling the Benchmark LA4, the CH Precision L1 and L10 (both in Global Feedback mode), the MBL N11, and the Pass Labs XP-32.—John Atkinson