Sidebar 3: Measurements
Because the CH Precision M1.1 is so heavy (165lb), I drove the 45 miles to Michael Fremer's home with my Audio Precision SYS2722 system (see the January 2008 "As We See It"), cables, noninductive power resistors, and analog and digital oscilloscopes, and I set up everything on a table in his garage. Because I knew from experience that the AC outlets in the garage are on a circuit with a 15A breaker, I ran two long extension cables—one for the test gear, one for the amplifier, which has two AC cords—to an outlet in the house that has a 20A circuit.
I performed a full set of measurements with one of the two amplifiers configured as Michael had done for his auditioning: "Monaural" mode, 0dB gain adjust, 20% global negative feedback, and driven via the balanced input. I repeated some of the tests with the high-impedance unbalanced input and with 0% and 100% negative feedback (footnote 1).
Before I test an amplifier, I precondition it with both channels driving a 1kHz tone for an hour at one-third power into 8 ohms, which is the most thermally stressful condition for an amplifier with a class-AB output stage. Because of time constraints, however, I preconditioned the M1.1 for 15 minutes. At the end of that time, the top panel was slightly warm at 82.4°F (28°C); aiming my infrared thermometer through the slots in the top panel at the heatsinks, the temperature was 101.5°F (38.6°C). I continued to monitor temperature, but the amplifier didn't get any warmer throughout the testing.
The voltage gain at 1kHz from the speaker terminals into 8 ohms measured 23.5dB for the balanced input, but, unusually, 6dB higher from the unbalanced input. Both inputs preserved absolute polarity (ie, were noninverting); the XLR jack is wired with pin 2 hot. The balanced input impedance was a usefully high 90k ohms at 20Hz and 1kHz, dropping inconsequentially to 58k ohms at 20kHz. The unbalanced input impedance was 45k ohms at 20Hz and 1kHz, 21k ohms at 20kHz.
The output impedance with 100% feedback, including a 6'-long, spaced-pair speaker cable, was a low 0.1 ohms across the audioband. With 20% feedback, it rose to 0.24 ohm at low and middle frequencies, and 0.27 ohm at the top of the audioband. But when I started to measure the CH amplifier's small-signal frequency response, I realized that I had left my standard simulated loudspeaker at home. However, this output impedance should result in the modulation of the amplifier's frequency response with this load by close to ±0.25dB. The M1.1's frequency response into 8 ohms (fig.1, blue trace) was flat to 20kHz and down by just 0.5dB at 60kHz; a 10kHz squarewave was therefore reproduced with very short risetimes (fig.2). A 1kHz squarewave was perfectly square (not shown). Though the ultrasonic output rolls off a little earlier into lower impedances, the response into 2 ohms (red trace) was down by just 0.3dB at 20kHz.


 The reduced linearity of the M1.1's circuit at high frequencies meant that when tested with an equal mix of 19 and 20kHz tones, the amplifier produced relatively high levels of intermodulation distortion, even at moderate powers (fig.13). The difference product at 1kHz lay at –66dB (0.05%) with many higher-order products present. This graph was taken with 20% feedback; increasing the feedback to 100% gave a much cleaner spectrum (fig.14).

 The CH Precision M1.1 is a powerful amplifier, but its measured performance is heavily dependent on the amount of global negative feedback selected. A measurement freak such as I would choose 100% feedback, but I note that Michael found 20% feedback to be the sweet spot when it came to the M1.1's sound quality. And note that no matter the percentage of feedback, this amplifier is more comfortable driving impedances higher than 2 ohms.—John Atkinson
Footnote 1: The CH Precision M1.1 features the same adjustable global negative feedback as the company's I1 integrated amplifier, which Jason Victor Serinus reviewed in February 2019. You can read my measurements of this amplifier here. Footnote 2: CH Precision says the meter on the M1.1 shows peak power, not RMS power; the rest of the discrepancy they attribute to a measuring technique that avoids adding components in series with the output signal.
Fig.1 CH Precision M1.1, frequency response at 2.83V into 8 ohms (blue), 4 ohms (magenta), and 2 ohms (red) (1dB/vertical div.).
Fig.2 CH Precision M1.1, small-signal 10kHz squarewave into 8 ohms.
The unweighted, wideband signal/noise ratio, taken with the unbalanced input shorted to ground and ref. 1W into 8 ohms, was 76.4dB, improving to 83.6dB with the measurement bandwidth restricted to 22Hz–22kHz and to 89.3dB with an A-weighting filter in circuit. Spectral analysis of the low-frequency noise floor (fig.3) indicated that there were AC power-supply–related spuriae at 60Hz and its odd-order harmonics, these presumably due to magnetic interference from the huge power transformer. Other than the spectral components at 60Hz and 180Hz, which were at a still-low –93dB and –97dB, these spuriae all lay close to –110dB (0.0003%), and the random noise-floor components were all extremely low in level.
Fig.3 CH Precision M1.1, spectrum, DC–1kHz, ref. 1W into 8 ohms (linear frequency scale).
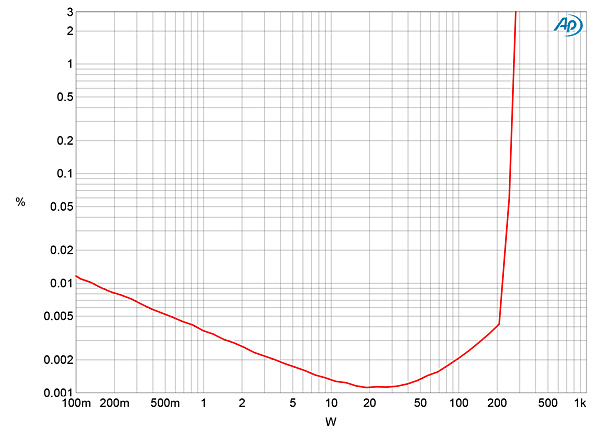
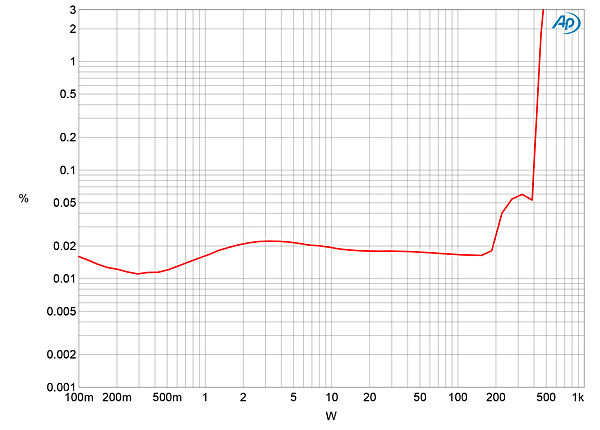
When I started testing the amplifier's output power, I fed the balanced input at 1kHz tone at 188mV, which resulted in exactly 1W into 8 ohms; the M1.1's meter read 2.3W.4 In its mono mode, the CH M1.1's maximum output is specified as 200W into 8 ohms (23dBW), 350W into 4 ohms (22.4dBW), and 600W into 2 ohms (21.8dBW). With clipping defined as when the THD+noise in the output reaches 1% and with the M1.1 set to 20% feedback, I measured a clipping power of 260W into 8 ohms (24.15dBW, fig.4). Increasing the feedback to 100% gave the same clipping power (fig.5), but the distortion is very much lower at all powers below 200W into 8 ohms. Into 4 ohms I measured 440W (23.4dBW, fig.6) and into 2 ohms 700W (22.4dBW, fig.7). I don't hold the wall voltage constant during these tests; it dropped from 122.5V AC with the amplifier idling to 118.5V AC at the measured clipping power into 2 ohms. The shortfall in maximum output power will not be an issue with typical loudspeakers and rooms, but it did puzzle me.
Fig.4 CH Precision M1.1, 20% NFB, distortion (%) vs 1kHz continuous output power into 8 ohms.
Fig.5 CH Precision M1.1, 100% NFB, distortion (%) vs 1kHz continuous output power into 8 ohms.
Fig.6 CH Precision M1.1, 20% NFB, distortion (%) vs 1kHz continuous output power into 4 ohms.
Fig.7 CH Precision M1.1, 20% NFB, distortion (%) vs 1kHz continuous output power into 2 ohms.
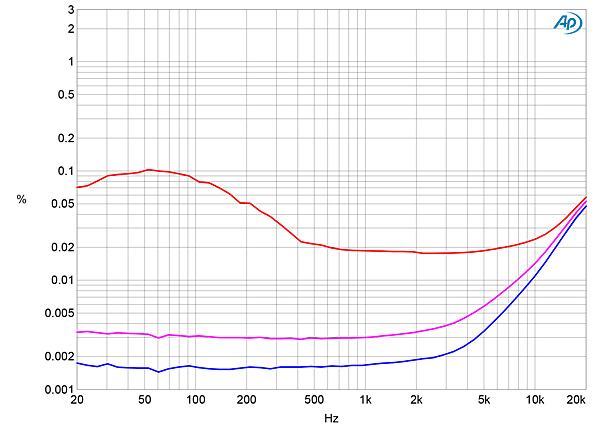
The traces in Figs. 4–7 suggested I examine how the M1.1's percentage of THD+N varied with frequency at 20V, which is equivalent to 50W into 8 ohms, 100W into 4 ohms, and 200W into 2 ohms. With 100% feedback (fig.8), the percentage of THD+N was extremely low into 8 ohms and 4 ohms in the bass and midrange, with the rise in the treble due to the decrease in open-loop voltage gain as the frequency increases. However, into 2 ohms (fig.8, red trace), the amplifier's distortion was 10 times higher in the midrange than it was into 8 ohms and even higher at low frequencies. Repeating the test with 20% feedback, which is how Michael did all his auditioning, the THD+N was higher into 4 and 8 ohms (fig.9, magenta and blue traces) but similar to the 100% feedback behavior into 2 ohms (red trace). Even so, it still lay below 0.1% below 10kHz.
Fig.8 CH Precision M1.1, 100% NFB, THD+N (%) vs frequency at 10V into: 8 ohms (blue), 4 ohms (magenta), and 2 ohms (red).
Fig.9 CH Precision M1.1, 20% NFB, THD+N (%) vs frequency at 10V into: 8 ohms (blue), 4 ohms (magenta), and 2 ohms (red).
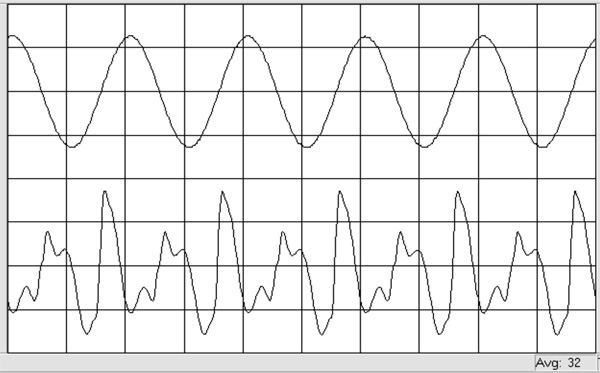
The THD+N waveform with 20% feedback at 100Wpc into 8 ohms (fig.10) indicates that while the distortion was low, at 0.018%, there were higher-order components present. With a low-frequency tone at 100Wpc into 8 ohms (fig.11), the second and third harmonics were the highest in level, at –93dB (0.002%) and –87dB (0.005%), respectively, with many higher-order harmonics visible. Repeating the analysis with 100% feedback (fig.12) kept the third harmonic at the same level, but the second harmonic dropped by 10dB and the higher-order products almost disappeared.
Fig.10 CH Precision M1.1, 20% NFB, 1kHz waveform at 100W into 8 ohms, 0.018% THD+N (top); distortion and noise waveform with fundamental notched out (bottom, not to scale).
Fig.11 CH Precision M1.1, 20% NFB, spectrum of 50Hz sinewave, DC–1kHz, at 100W into 8 ohms (linear frequency scale).
Fig.12 CH Precision M1.1, 100% NFB, spectrum of 50Hz sinewave, DC–1kHz, at 100W into 8 ohms (linear frequency scale).
Fig.13 CH Precision M1.1, 20% NFB, HF intermodulation spectrum, DC–30kHz, 19+20kHz at 50W peak into 8 ohms (linear frequency scale).
Fig.14 CH Precision M1.1, 100% NFB, HF intermodulation spectrum, DC–30kHz, 19+20kHz at 50W peak into 8 ohms (linear frequency scale).
Footnote 1: The CH Precision M1.1 features the same adjustable global negative feedback as the company's I1 integrated amplifier, which Jason Victor Serinus reviewed in February 2019. You can read my measurements of this amplifier here. Footnote 2: CH Precision says the meter on the M1.1 shows peak power, not RMS power; the rest of the discrepancy they attribute to a measuring technique that avoids adding components in series with the output signal.


