Sidebar 3: Measurements
I performed the measurements of the LSA VT-70 with my Audio Precision SYS2722 system. Although potentiometers on the top panel allow the bias currents for the output tubes to be adjusted, I understand that these currents are set by the manufacturer before the amplifier leaves the factory. Nevertheless, before I started the testing, I checked the tube bias with the front-panel meters after a 30-minute warm-up; with no signal and the volume control set to its minimum, the bias was very close to an indicated "100" for each tube.
The LSA VT-70 preserved absolute polarity, ie, was noninverting, from both of its output transformer taps, from the headphone output, and from the preamplifier output. The maximum voltage gain at 1kHz from the loudspeaker outputs into 8 ohms was 37.4dB from the 8 ohm tap, 36.17dB from the 4 ohm output tap. The maximum gain from the headphone output was 41.4dB and from the preamplifier output, it was –0.23dB, ie, slightly lower than the input level. The single-ended input impedance is specified as a high 100k ohms. I measured a still-high 42k ohms at 20Hz, 44k ohms at 1kHz, and 39k ohms at 20kHz.
The preamplifier output impedance was a low 2 ohms at high and middle frequencies, though it rose to 265 ohms in the low bass, presumably due to the presence of a series coupling capacitor. The headphone output's source impedance was a high 470 ohms across the audioband, which means this output will not be optimal for use with low-impedance headphones.
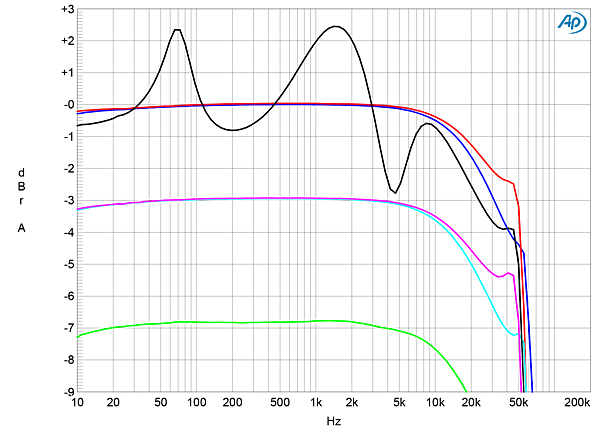
Although the VT-70's loudspeaker output impedance is specified as 8 ohms or 4 ohms, I suspect that these actually refer to the nominal values of the output transformer taps. The source impedance of the 8 ohm tap was a very high 5.1 ohms at low and midrange frequencies, rising to 7.4 ohms at the top of the audioband. As expected, the impedance was lower from the 4 ohm tap, at 2.7 ohms at 20Hz and 1kHz, 3.8 ohms at 20kHz. The variation in the LSA-70 amplifier's small-signal frequency response from the 8 ohm tap with our standard simulated loudspeaker (fig.1, gray trace) was an audible ±2.4dB. From the 4 ohm tap (not shown), the variation was smaller, at ±1.75dB, but this will still be audible. Into resistive loads (fig.1, blue, red, cyan, magenta, and green traces), the VTA-70 started to gently roll off in the top octave, with then a sharp dropoff above 45kHz.
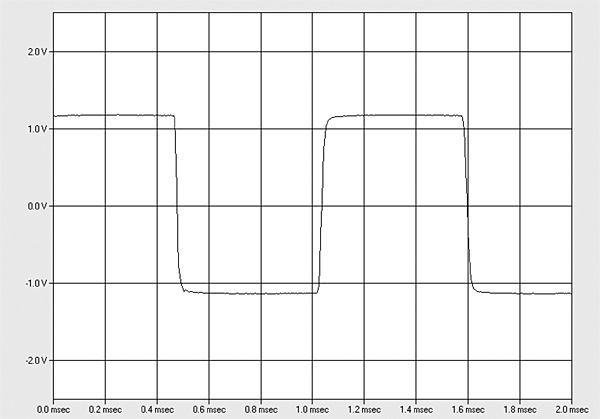
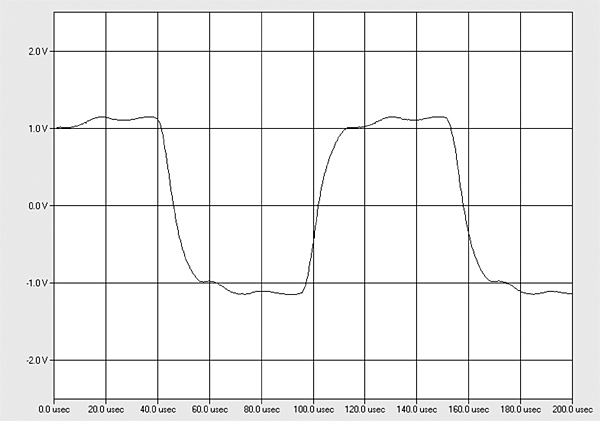
 The VT-70's reproduction of a 1kHz squarewave into 8 ohms (fig.2) was superbly square, which correlates with the extended low frequencies seen in fig.1. However, the ultrasonic rolloff lengthened the risetimes of a 10kHz squarewave (fig.3), and the small peak just above 40kHz in the frequency response is associated with some ringing on the tops and bottoms of the waveform.
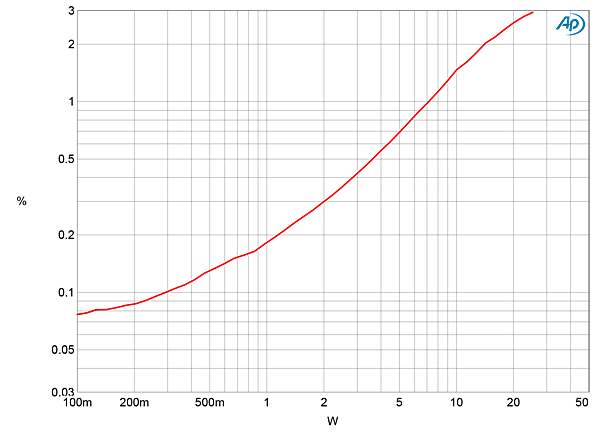
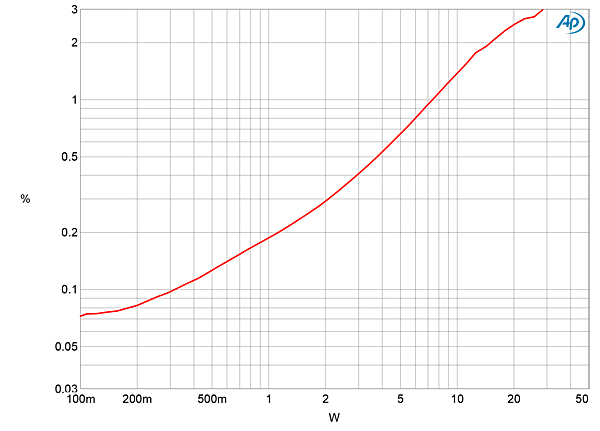
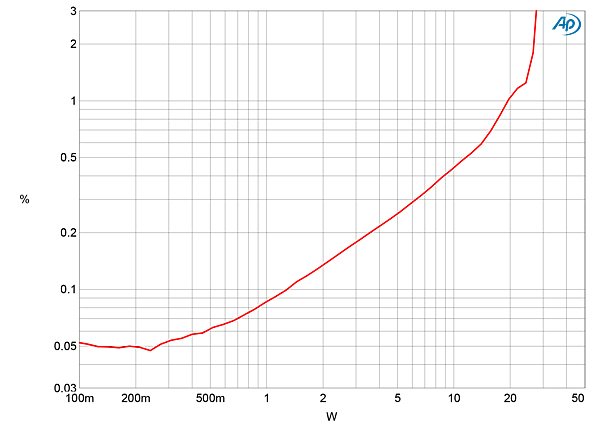
 LSA specifies the VT-70's maximum power as 35Wpc into 8 ohms (15.44dBW), which is what I would expect from a push-pull pair of EL34 tubes operated in Ultralinear mode. (The traces in figs.5–7 were taken with the left channel but with both channels operating.) With our usual definition of clipping—when the THD+noise reaches 1%—and with both channels driven, I measured a clipping power of just 7Wpc from the 8 ohm tap into 8 ohms (8.45dBW, fig.5) and the same from the 4 ohm tap into 4 ohms (5.45dBW, fig.6). Relaxing the clipping definition to 3% THD+N gave output powers of 25.3Wpc from the 8 ohm tap into 8 ohms (14.0dBW) and 28.45Wpc from the 4 ohm tap into 4 ohms (11.53dBW). The shape of the traces in these graphs suggests that the amplifier uses a limited amount of loop negative feedback. With the 4 ohm tap driving 8 ohms (fig.7), 1% THD+N was reached at 19.5Wpc (12.9dBW) and 3% THD+N at 27Wpc (14.3dBW). More significantly, the THD+N was lower at low powers than it had been with the load matched to the nominal transformer tap.
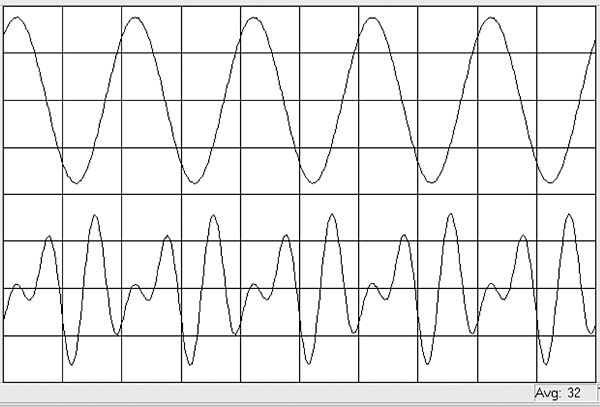
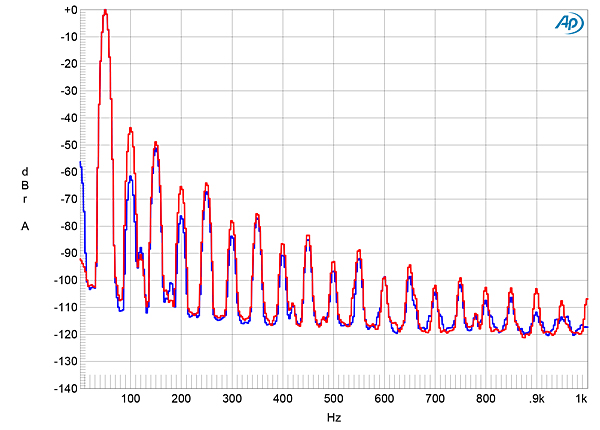
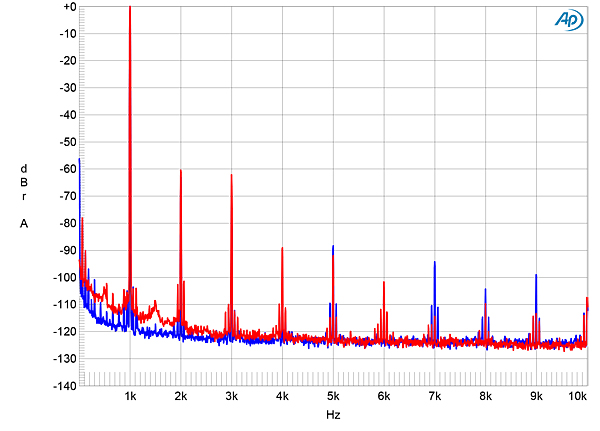
 The distortion waveform from either tap (fig.9) suggests that the second harmonic was dominant. However, at low frequencies, the third harmonic was the highest in level (fig.10), which again will be due to the output transformer. Note that the right channel's second harmonic in this graph is almost 20dB higher than in the left channel. This might have been due to the output tubes' bias currents not being sufficiently closely matched in that channel, except that these appeared identical when I checked the bias before testing. It is more likely, therefore, that one of the right channel's output tubes had aged out of spec. (In a push-pull circuit with perfectly matched devices, there is no even-order distortion.) However, at the same output voltage at higher frequencies (fig.11), the second and third harmonics are equally high in level in both channels, each close to –60dB (0.1%).
 The LSA VT-70's measured performance is typical of a conventional tubed design using a push-pull pair of EL34s for its output stage and with only a small amount of loop negative feedback. The lowest distortion will be obtained from the 4 ohm output transformer tap, especially driving impedances >4 ohms, with no significant reduction in maximum power.—John Atkinson
Fig.1 LSA VT-70, 8 ohm tap, frequency response at 2.83V into: simulated loudspeaker load (gray), 8 ohms (left channel blue, right red), 4 ohms (left cyan, right magenta), and 2 ohms (green) (2dB/vertical div.).
Fig.1, taken with the volume control set to its maximum, features excellent channel matching. The channel gains were less well-matched at lower settings of the volume control, with the right channel almost 1dB higher in level than the left when the control was set to –10dB. This difference decreased to 0.3dB with the control set to –20dB.
Fig.2 LSA VT-70, 8 ohm tap, small-signal 1kHz squarewave into 8 ohms.
Fig.3 LSA VT-70, 8 ohm tap, small-signal 10kHz squarewave into 8 ohms.
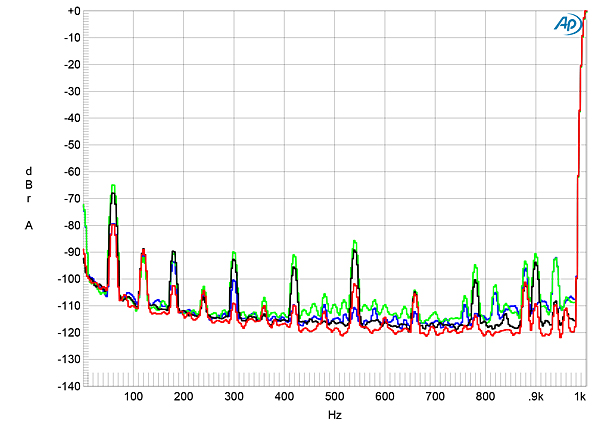
The VT-70's channel separation (not shown) was >60dB in both directions below 2kHz but decreased to 40dB R–L and 46dB L–R at 20kHz. The unweighted, wideband signal/noise ratio (ref.1W into 8 ohms, taken from the 8 ohm tap and measured with the input shorted to ground) was a good 76.7dB (average of the two channels). This ratio improved slightly, to 77.8dB, when the measurement bandwidth was restricted to 22Hz–22kHz, and to 90.1dB when A-weighted. The S/N ratios at the 4 ohm taps were around 1.5dB greater. Spectral analysis of the low-frequency noisefloor while the LSA's 8 ohm tap drove a 1kHz tone at 1Wpc into 8 ohms (fig.4, blue and red traces) revealed a low level of random noise, and the AC-related spuriae at 60Hz and its odd- and even-order harmonics lay at or below –80dB. This graph was taken with the volume control set to its maximum. Peculiarly, with the control set to –20dB, the odd-order AC-related spuriae were all higher in level.
Fig.4 LSA VT-70, 8 ohm tap, spectrum of 1kHz sinewave, DC–1kHz, at 1W into 8 ohms with volume control set to its maximum (left channel blue, right red) and to –20dB (left green, right gray) (linear frequency scale).
Fig.5 LSA VT-70, 8 ohm tap, distortion (%) vs 1kHz continuous output power into 8 ohms.
Fig.6 LSA VT-70, 4 ohm tap, distortion (%) vs 1kHz continuous output power into 4 ohms.
Fig.7 LSA VT-70, 4 ohm tap, distortion (%) vs 1kHz continuous output power into 8 ohms.
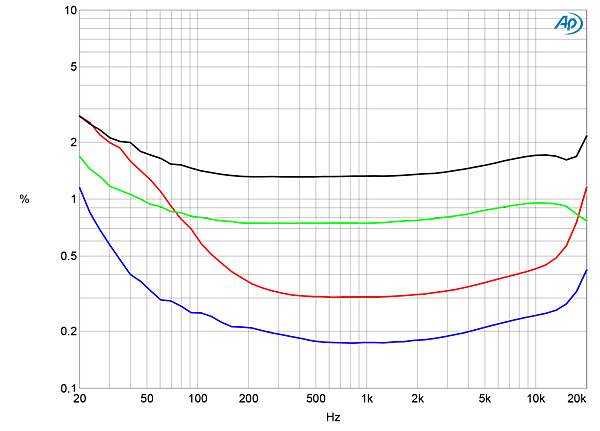
Fig.8 shows how the percentage of THD+N in both channels varied with frequency from the 4 ohm tap into 8 and 4 ohms at 4.9V, which is equivalent to 3W into 8 ohms and 6W into 4 ohms. The THD+N was higher in the right channel (red and gray traces) than the left (blue, green) and as, shown in fig.7, was lower with the higher load impedance. The THD rose at low frequencies due to the onset of core saturation in the output transformer. The THD+N percentage at the same voltage from the 8 ohm tap (not shown) was about 5 times as high as it was from the 4 ohm tap.
Fig.8 LSA VT-70, 4 ohm tap, THD+N (%) vs frequency at 4.9V into: 8 ohms (left channel blue, right red), 4 ohms (left green, right gray).
Fig.9 LSA VT-70, 8 ohm tap, left channel, 1kHz waveform at 3W into 8 ohms, 0.18% THD+N (top); distortion and noise waveform with fundamental notched out (bottom, not to scale).
Fig.10 LSA VT-70, 4 ohm tap, spectrum of 50Hz sinewave, DC–1kHz, at 1Wpc into 8 ohms (left channel blue, right red; linear frequency scale).
Fig.11 LSA VT-70, 4 ohm tap, spectrum of 1kHz sinewave, DC–10kHz, at 1Wpc into 8 ohms (left channel blue, right red; linear frequency scale).
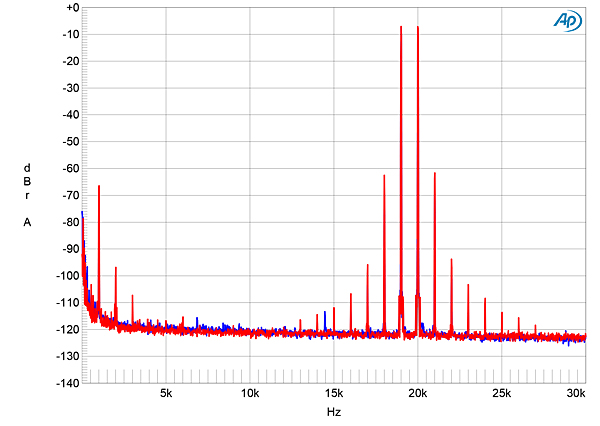
Despite the relatively high level of harmonic distortion, intermodulation distortion was only moderate in level. With the VT-70's 8 ohm taps driving an equal mix of 19 and 20kHz tones at 1Wpc peak into 8 ohms (fig.12), the 1kHz difference product lay at –66dB (0.05%). The higher-order products at 18 and 21kHz were only 4dB higher in level.
Fig.12 LSA VT-70, 8 ohm tap, HF intermodulation spectrum, DC–30kHz, 19+20kHz at 1Wpc peak into 8 ohms (left channel blue, right red; linear frequency scale).