
Sidebar 3: Measurements
I can now say emphatically that John Atkinson's measurements of audio equipment looked easy because he made it look that way, not because it was. We all came to expect that every month in Stereophile, we would be presented with countless accurate measurements of all manner of hi-fi equipment with little or no drama. I'm now on my third day of measurements, in the midst of a previously planned Palm Springs vacation, sweating over a dozen or more measurement subtleties that have made this review challenging.
I measured the Luxman L-100 Centennial using a Prism Sound dScope III audio analyzer and a PicoScope 4824A USB oscilloscope. Prior to starting measurements, I preconditioned the amplifier for 30 minutes; the class-A idle dissipation is high enough that idle warm-up, with just a 1W signal to keep the automatic sleep function from triggering, was sufficient to reach operating temperature. I did not have my thermal camera handy for these measurements, but I can say that even the heatsink vents stayed within the temperature range where I could rest my hand on them comfortably.
The Luxman preserved absolute polarity on all inputs, though the balanced inputs include a phase reversal switch for dealing with pin-3-hot vs pin-2-hot balanced sources. Volume adjustment was quite easy: The LECUA control adjusts in 88 steps of 1dB. Maximum gain in Line Straight mode (tone control bypass) to the speaker outputs was 43.6dB for unbalanced inputs, 37.5dB for balanced inputs. Gain at the headphone outputs was identical. Gain to the pre-outs was 14.5dB for unbalanced inputs, 8.4dB for balanced inputs.
The unbalanced line input impedance measured 46.9k ohms at 20Hz and 46.8k ohms at 1kHz, falling to 27.6k ohms at 20kHz. The balanced input measured 54.1k ohms differentially at 1kHz (27.1k ohms common mode), falling to 34.8k ohms at 20kHz.
The preamplifier output impedance measured around 692 ohms within 1%, 20–20kHz. The power amp input impedance was 48.9k ohms at 1kHz, increasing to 49.3k ohms at 20Hz and dropping to 19.9k ohms at 20kHz.
The headphone output impedance measured 819 ohms across the audioband. The power amplifier output impedance, estimated by comparing the voltage response at the speaker terminals under 100k ohm, 8 ohm, and 4 ohm loading, measured 0.028 ohms. This amplifier has a relatively high damping factor and will drive low-impedance speakers successfully.
Comparing to the phono preamp measurements taken with shorting plugs and output isolation transformers revealed that the majority of the higher harmonic spuriae are from interactions between the analyzer and the amplifier, because they use different grounding schemes.
Phono overload margins were among the highest I have ever measured: ~30dB in MM at 20Hz, 100Hz, and 1kHz, and 33dB in MC mode through 10kHz. At the remaining high-frequency measurement points, the analyzer generator reached my predetermined safety limit before the phono stage reached 1% THD+N, so the high-frequency margins may be even higher. The strongest harmonic in MM mode (not shown) ranged from –99.8dB to –93.6dB. In MC mode, the strongest harmonic ranged from –97.7dB to –88.3dB. Phono intermodulation products were likewise low in both MM and MC modes (not shown), with the 1kHz product at –87.1dB in MM and –92.3dB in MC.
These measurements reveal the Luxman L-100 Centennial as a product designed with care in every technical aspect, with close channel matching even in equalized modes and across all volume settings and excellent overload margin in both phono and line-stage sections. The L-100 Centennial meets its class-A power ratings, with class-AB margin more than 3× higher. The damping factor is high enough to control speakers with low and widely varying impedance curves.—Dylan Wahl
Fig.1 Luxman L-100, Frequency response at 2.83V into 8 ohms (blue), 4 ohms (red), 2 ohms (cyan), and the simulated loudspeaker load (grey), and repeated on 8 ohms at a mid-volume setting (green); tone defeat engaged (0dB = 2.83V into 8 ohms at 1kHz, 1dB/vertical div.).
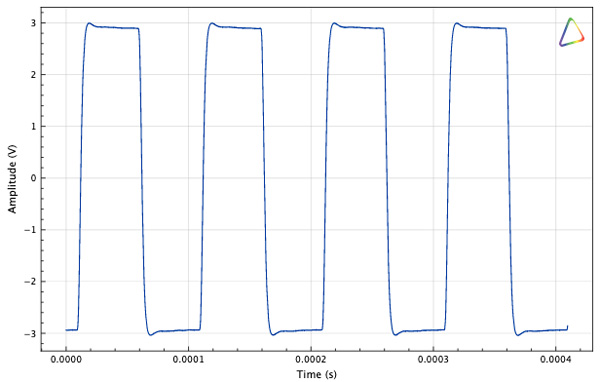
Fig.2 Luxman L-100, 10kHz squarewave DUT output at 2.836V into 8 ohms (rise 4.02µs, fall 4.03µs, overshoot 1.6%).
The amplifier's small-signal frequency response (fig.1) was essentially unchanged between 8, 4, and 2 ohm resistive loads and the simulated loudspeaker load. Note that for this plot, analyzer bandwidth was restricted to 90kHz, as the focus was on variation with load impedance. The analyzer's 80kHz filter was enabled for this measurement; this was the cause of the observed rolloff. The audioband response changed by no more than 0.1dB between maximum and the mid-volume position. The 10kHz, 1W squarewave response (fig.2) was well controlled. There was evidence of coupling between my source and output cabling, as the leading-edge overshoot changed with cable position, and the effect increased with the volume-control setting. Care should be taken to route source cables away from speaker output cables, and well-shielded interconnects should be used.
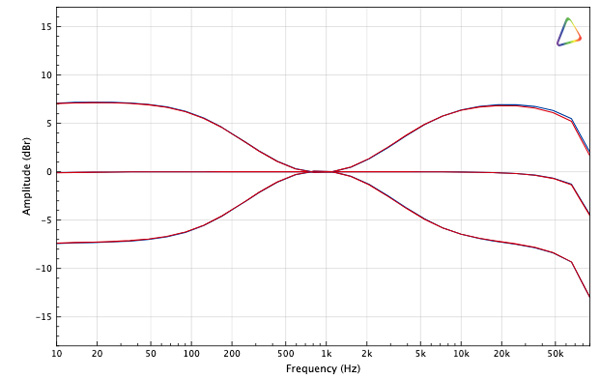
Fig.3 Luxman L-100, Response at 0.5W into 8 ohms with tone defeat engaged (flat), bass and treble at maximum boost, and bass and treble at maximum cut; left channel blue, right red (0dB = 2.00V at 1kHz, 5dB/vertical div.).
Channel balance (fig.3) in both Line Straight and tone-control boost/cut modes was excellent. Tone controls produced a maximum measured boost of 7.2dB and a maximum cut of 8.6dB.
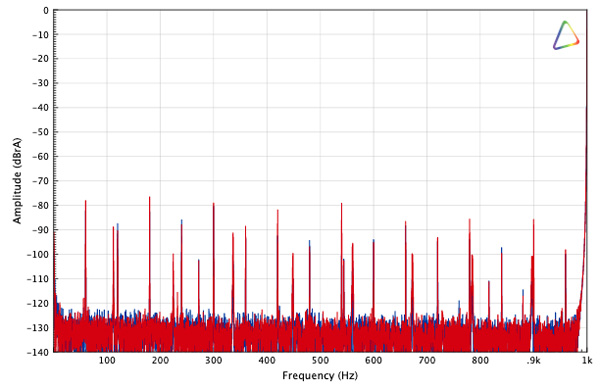
Fig.4 Luxman L-100, Spectrum of 1kHz sinewave, DC–1kHz, at 1Wpc into 8 ohms, volume at maximum; left channel blue, right red (linear frequency scale, 0dB = 2.83V).
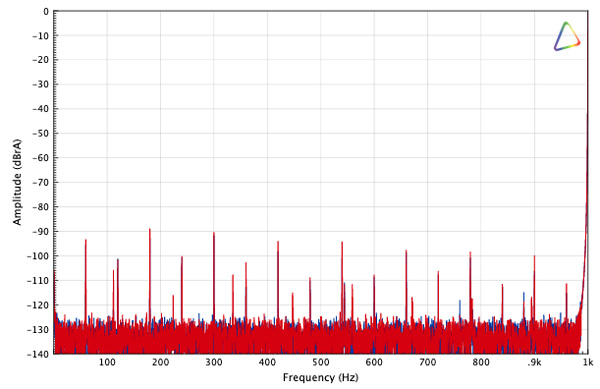
Fig.5 Luxman L-100, Spectrum of 1kHz sinewave, DC–1kHz, at 1Wpc into 8 ohms, volume control at –20dB, input raised to hold 1Wpc; left channel blue, right red (linear frequency scale, 0dB = 2.83V).
Channel separation was acceptable: At low frequencies, the unbalanced inputs reached 76dB of separation at 20Hz through 1kHz, dropping to 63dB at 10kHz and 51dB at 20kHz. Low-frequency spectral measurements at 1W into 8 ohms (fig.4) showed the strongest identified supply-related spuriae at –79.8dB in the left channel (300Hz) and –76.4dB in the right (180Hz), referred to the 1kHz fundamental. Reducing the volume by 19.9dB and increasing the input drive to restore the output reference level (fig.5) improved the spuriae levels by around 10dB.
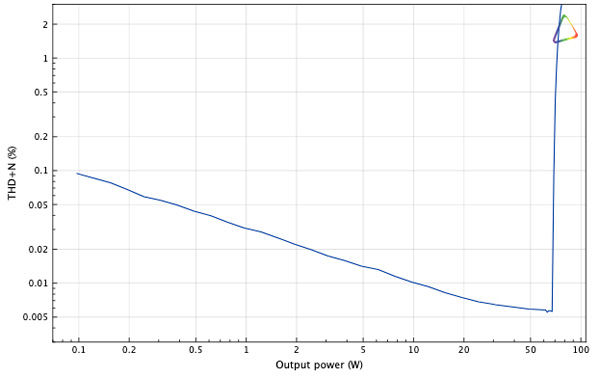
Fig.6 Luxman L-100, Distortion (%) vs 1kHz continuous output power into 8 ohms (clipping at 71.96W, 18.57dBW).
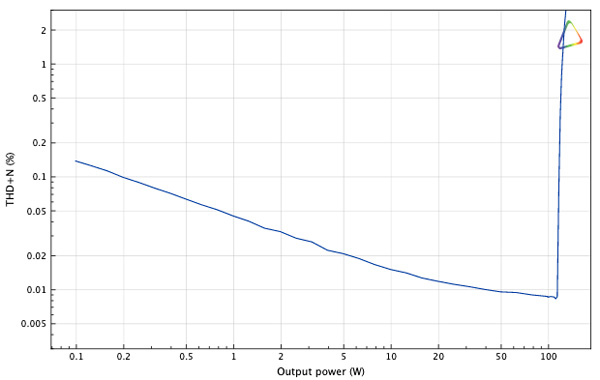
Fig.7 Luxman L-100, Distortion (%) vs 1kHz continuous output power into 4 ohms (clipping at 122W, 20.86dBW).
At the usual 1% THD+N criterion, the amplifier clipped at 72W into 8 ohms (18.57dBW; fig.6), and 122W into 4 ohms (17.86dBW; fig.7). At 8 ohms, the distortion minimum was 0.0087% at 51.3W.
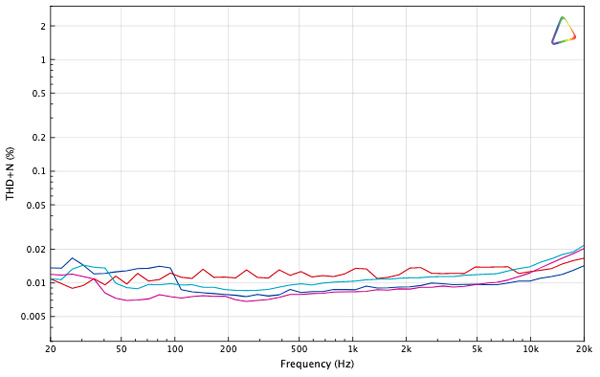
Fig.8 Luxman L-100, THD+N (%) vs frequency at 12.65V (20W into 8 ohms, operator selected), 192kHz sampling, 80kHz low-pass filter: 8 ohms left blue, right red; 4 ohms left cyan, right magenta.
I evaluated THD+N versus frequency at the rated class-A output power of 20W into 8 ohms and 40W into 4 ohms (fig.8). THD+N was very low throughout the audioband, suggesting that the L-100's power amplifier has wide enough feedback bandwidth that there is very little phase shift through at least 40kHz. The worst recorded results were 0.0167% into 8 ohms and 0.0217% into 4 ohms; the latter occurred at 20kHz.
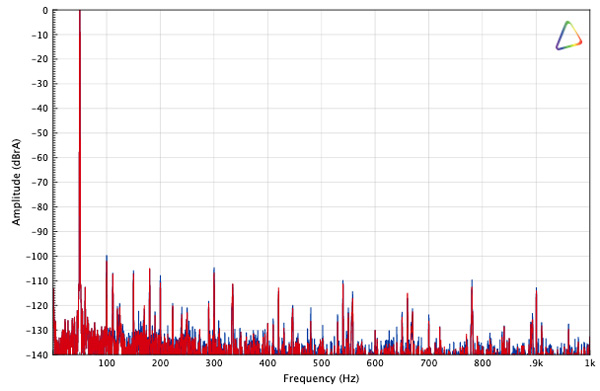
Fig.9 Luxman L-100, Spectrum of 50Hz sinewave, DC–1kHz, at 50W into 8 ohms (20V); left channel blue, right red (linear frequency scale, 0dB = the 50Hz fundamental).
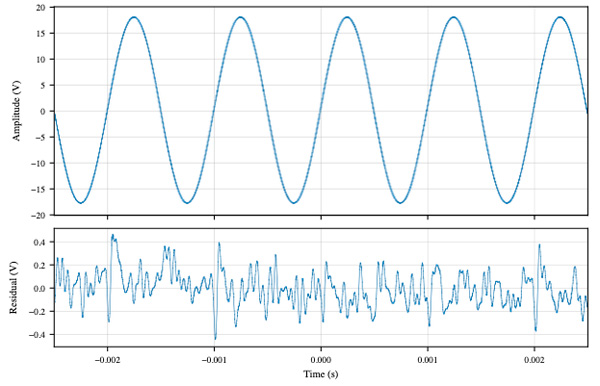
Fig.10 Luxman L-100, 1kHz waveform at 20W into 8 ohms (top); distortion and noise residual (bottom); THD 0.0200%..
Looking at the distortion spectrum (fig.9) of a 50Hz sinewave at 50W into 8 ohms, the second harmonic dominated, at –100dB (ref. the fundamental). All other harmonics were observed at lower, inaudible levels. Looking at the 1kHz distortion residual at the 20W-rated class-A output power (fig.10), only wideband noise was visible, at a very low 0.035%.
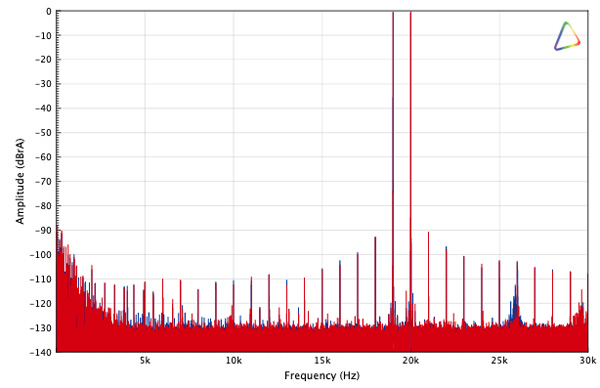
Fig.11 Luxman L-100, HF intermodulation spectrum, DC–30kHz, 19+20kHz at 1:1 at 30W peak into 8 ohms (7.746V per tone, 10.95V composite); left channel blue, right red (linear frequency scale, 0dB = the per-tone level).
With equal 19kHz and 20kHz tones, the 1kHz difference product (fig.11) lay at –99.7dB left and –100.7dB right (0.0010% and 0.0009%). The highest recorded third-order product was the 21kHz component at –90.6dB left, –91.0dB right (0.0030% and 0.0028%).
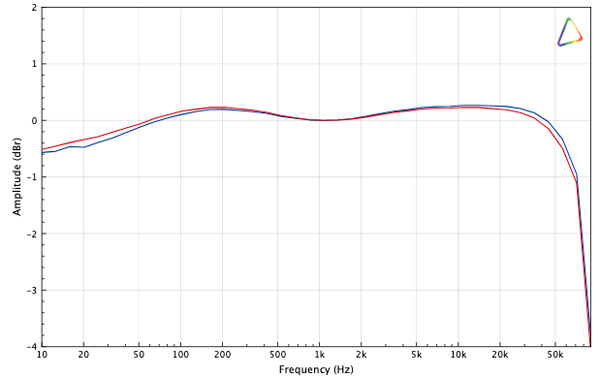
Fig.12 Luxman L-100, Phono input, MM mode, response error with inverse-RIAA pre-emphasis applied, volume 20.1dB below maximum (positioned live from the measured full-volume phono reference); left channel blue, right red (normalized to 0dB at 1kHz, 1dB/vertical div.).
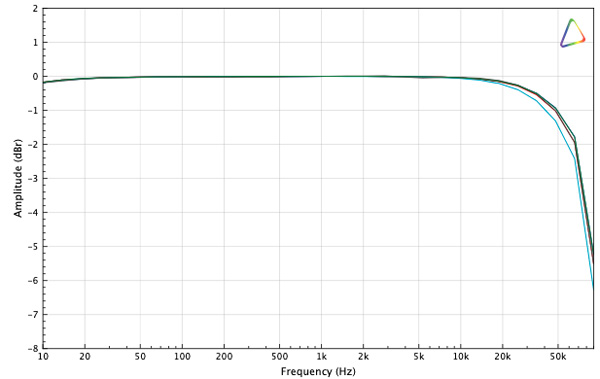
The phono section offered 50.3/50.2dB direct MM gain and 67.5/67.4dB direct MC gain, an additional 17.2–17.3dB in MC mode (this is measured at the Pre-out jacks). The MM load resistance was ~46k ohms up to 1kHz and 21.1k ohms at 20kHz; the fixed MC input load resistance was ~98 ohms across the audioband. RIAA accuracy was good, and channel match was excellent (fig.12). From 20Hz to 20kHz, the maximum MM errors were –0.47dB left and –0.34dB right, both at 20Hz, with a channel imbalance of just 0.02dB at 1kHz. (The rolloff seen in the figure is due to the analyzer's internal filter.) The maximum MC errors were 0.31dB and 0.33dB, with an extremely low 0.08dB channel imbalance. The moving magnet S/N ratio was 82.1dB wideband, 85.5dB A-weighted. The moving coil S/N ratio measured 63.8–65.0dB wideband and 70.6–71.4dB A-weighted.