Sidebar 3: Measurements
I tested the McIntosh MAC7200 with my Audio Precision SYS2722 system (see the January 2008 "As We See It"). I looked first at its behavior via its balanced and single-ended line inputs, mostly with the volume control set to its maximum, "100%," then at lower settings. I performed a complete set of tests from the receiver's 8 ohm output transformer tap, then repeated several tests from the 4 ohm and 2 ohm taps. I preconditioned the receiver by following the CEA's recommendation of operating it at one-eighth the specified power into 8 ohms for 30 minutes. At the end of that time, the heatsinks were very hot, at 151.8°F (66.6°C). After letting the MAC7200 cool down, I continued the testing.
For the balanced input, the maximum gain at the loudspeaker outputs into 8 ohms was 38.25dB from the 8 ohm tap, 34.7dB from the 4 ohm tap, and 32.2dB from the 2 ohm tap. The maximum gains from the unbalanced inputs were all 6dB higher. With the jumpers that connect the preamplifier outputs to the power amplifier inputs removed, the gains from the input labeled "PWR AMP" measured 20.2dB at the 8 ohm tap, 16.7dB at the 4 ohm tap, and 14.2dB at the 2 ohm tap. From the unbalanced line input at the preamplifier and headphone outputs, the maximum gain measured 15.4dB and 19.6dB, respectively. The MAC7200 preserved absolute polarity (ie, was noninverting) at all of its outputs.
The MAC7200's unbalanced line input impedance was 21.5k ohms at 20Hz and 1kHz, dropping to 19k ohms at 20kHz. The balanced input impedance was 33k ohms across the audioband. The power amplifier input impedance was 10k ohms from 20Hz to 20kHz. The preamplifier output impedance was a low 220 ohms at 1kHz and 20kHz, increasing to 403 ohms at 20Hz; the headphone output impedance was 48 ohms at all audio frequencies. The McIntosh's headphone output will work best with high-impedance headphones.
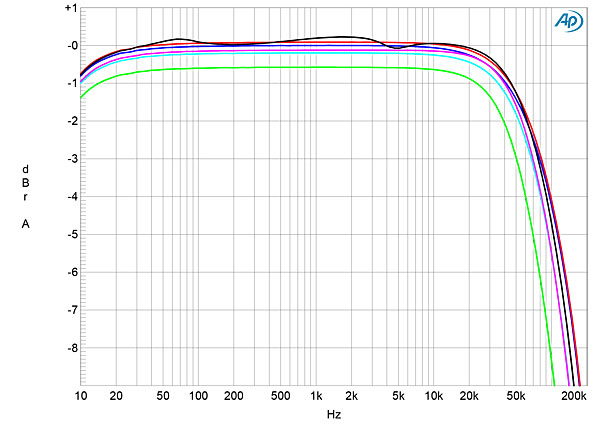
The amplifier's output impedance at the 8 ohm tap was 0.16–0.19 ohms depending on frequency. The 4 ohm tap's output impedance was 0.114 ohms, that of the 2 ohm tap 0.12 ohms, both from 20Hz to 20kHz. All these measurements include the series impedance of the loudspeaker cable. The modulation of the amplifier's frequency response, due to the Ohm's law interaction between this source impedance and the impedance of our standard simulated loudspeaker, was very small, even from the 8 ohm tap (fig.1, gray trace). The small-signal bandwidth with the volume control set to its maximum was flat up to 20kHz from all three output transformer taps and was down by 3dB at 90kHz. Channel matching was excellent and maintained at lower settings of the volume control. The receiver's reproduction of a 10kHz squarewave from all three taps (fig.2) was free from overshoot and ringing.


 The MAC7200's RIAA correction offered very low error (fig.13) and was well-matched between the channels. Channel separation via the phono input was good, at 70dB in both directions at all audio frequencies. The phono input's noise performance in MM mode was excellent, with unweighted audioband signal/noise ratios (ref. 1kHz at 5mV input signal) of 79.2dB (average of both channels). The ratios improved to 84.6dB when A-weighted. The higher gain in the MC mode reduced the S/N ratio; the unweighted wideband ratio ref. 1kHz at 500ÊV was 66.1dB and 83dB, A-weighted.

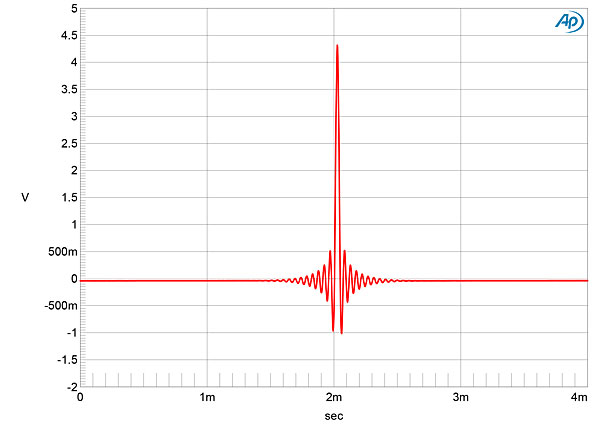
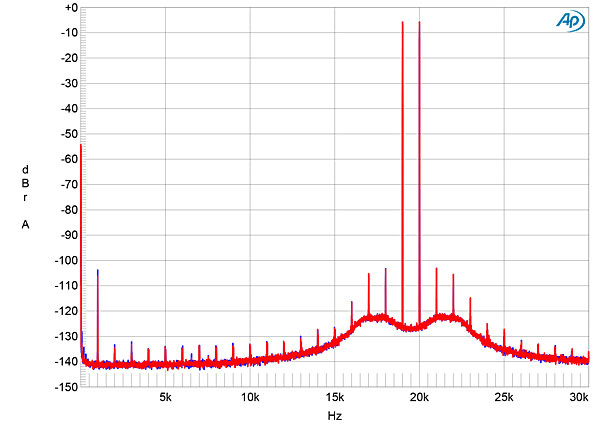
 The McIntosh's USB and S/PDIF inputs preserved absolute polarity. The impulse response with 44.1kHz data (fig.15) indicates that the reconstruction filter is a conventional linear-phase type, with time-symmetrical ringing on either side of the single sample at 0dBFS. With 44.1kHz-sampled white noise (fig.16, red and magenta traces), the MAC7200's response rolled off sharply above 20kHz, reaching full stop-band suppression just above half the sample rate (vertical green line). An aliased image at 25kHz of a full-scale tone at 19.1kHz (blue and cyan traces) is suppressed by more than 110dB, and though the distortion harmonics of the 19.1kHz tone can be seen, these are all very low in level. The second harmonic is the highest in level, at –90dB (0.003%). The MAC7200's digital-input frequency response was flat in the audioband and follows the same basic shape, but with a slight peak just before the sharp rolloff at half of each sample rate (fig.17).


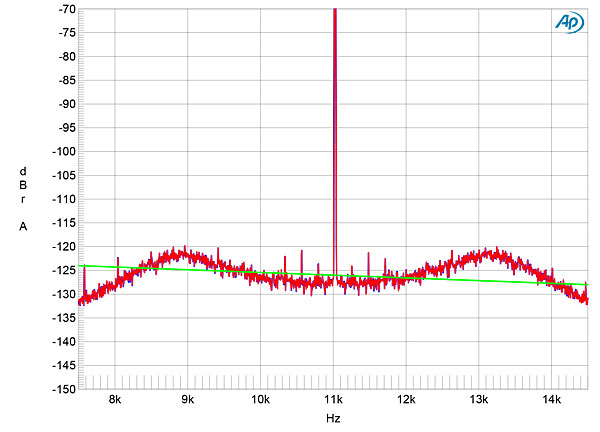
 Intermodulation distortion via the McIntosh amplifier's digital inputs was very low, but there was an odd scalloping of the noise floor either side of the twin tones at 19kHz and 20kHz (fig.19; this can also be seen in fig.16). This modulation of the noise floor was also evident when I tested the MAC7200 for its rejection of word-clock jitter via its S/PDIF and USB inputs, obscuring the odd-order harmonics of the 16-bit J-Test signal's LSB-level, low-frequency squarewave (fig.20).
 Overall, the McIntosh MAC7200 performed very well on the test bench via its line inputs, exceeding its specified power and offering extremely low distortion. It also includes an excellent phono input that offers low noise and low distortion in both MM and MC modes. However, while the digital inputs offer excellent resolution, I was bothered by the modulation of the noise floor with high-level, high-frequency tones (footnote 1).—John Atkinson
Footnote 1: This scalloping of the noise floor is probably not audible as such, However, it is always suspicious when a product's transfer function is modified by the signal.
Fig.1 McIntosh MAC7200, 8 ohm tap, frequency response at 2.83V into: simulated loudspeaker load (gray), 8 ohms (left channel blue, right red), 4 ohms (left cyan, right magenta), 2 ohms (green) (1dB/vertical div.).
Fig.2 McIntosh MAC7200, 8 ohm tap, small-signal 10kHz squarewave into 8 ohms.
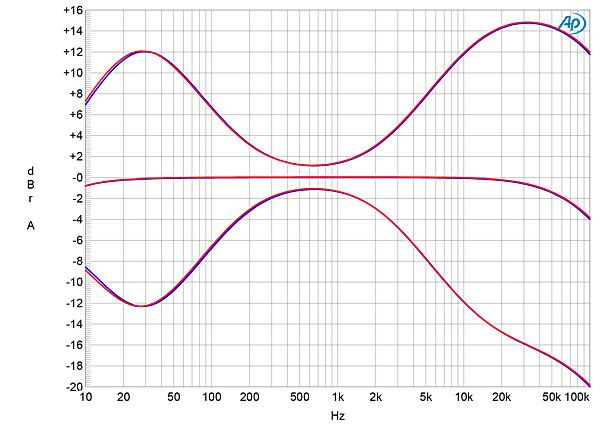
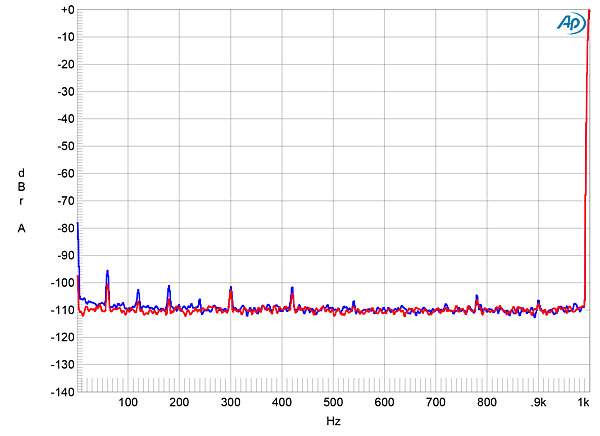
Fig.3 shows the effects of the treble and bass controls, set to their +12 and –12 positions compared with the response with the controls bypassed. While the maximum boost or cut at low frequencies was ±12dB, it reached ±15dB at high frequencies. Channel separation via the line inputs (not shown) was okay, at just below 70dB in both directions. The level of the McIntosh's noise floor depended on the volume control setting. With the control set to its maximum, a small number of low-level supply-related spuriae can be seen just above the random noise floor (fig.4). The wideband, unweighted S/N ratio, taken with the unbalanced inputs shorted to ground and the volume control set to its maximum, was 69.3dB, average of both channels, ref. 2.83V output from all three output taps into 8 ohms. Restricting the measurement bandwidth to the audioband increased the S/N ratio to 78.0dB, while switching an A-weighting filter into circuit improved it further to 80.6dB.
Fig.3 McIntosh MAC7200, 8 ohm tap, frequency response at 2.83V into 8 ohms with treble and bass controls set to their maximum and minimum and switched out of circuit (left channel blue, right red, 5dB/vertical div.).
Fig.4 McIntosh MAC7200, 8 ohm tap, spectrum of 1kHz sinewave, DC–1kHz, at 1W into 8 ohms with volume control set to "100%" (left channel blue, right red, linear frequency scale).
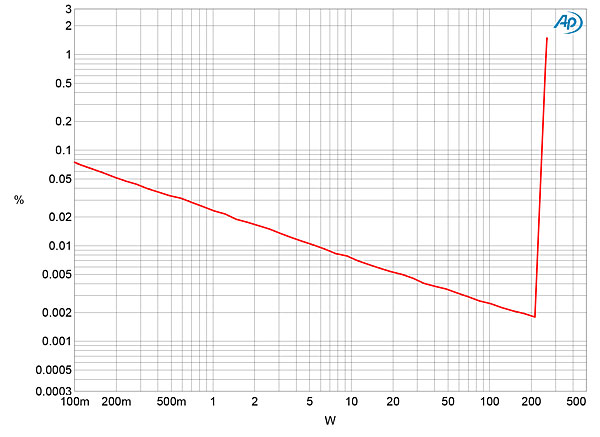
Figs.5, 6, and 7 plot the percentage of THD+noise in the MAC7200's speaker output from the 8 ohm tap into 8 ohms, the 4 ohm tap into 4 ohms, and the 2 ohm tap into 2 ohms. In each graph, the THD+N continues to drop as the power decreases below actual waveform clipping, due to the distortion lying beneath the noise floor and the fixed level of noise becoming an increasing percentage of the signal level. The receiver's maximum power is specified as being at least 200W from each of the output-transformer taps. Using our definition of clipping, which is when the output's percentage of THD+noise reaches 1%, the 8 ohm tap clipped at 255W into 8 ohms (24dBW) with both channels driven, the 4 ohm tap at 235W into 4 ohms (20.7dBW) with both channels driven, and the 2 ohm tap at 283W into 2 ohms (18.5dBW) with one channel driven. More power was available when the load impedance was lower than the nominal tap impedance. For example, with its 8 ohm tap driving 4 ohms, the McIntosh clipped at 340W into 4 ohms (22.3dBW, fig.8).
Fig.5 McIntosh MAC7200, 8 ohm tap, distortion (%) vs 1kHz continuous output power into 8 ohms.
Fig.6 McIntosh MAC7200, 4 ohm tap, distortion (%) vs 1kHz continuous output power into 4 ohms.
Fig.7 McIntosh MAC7200, 2 ohm tap, distortion (%) vs 1kHz continuous output power into 2 ohms.
Fig.8 McIntosh MAC7200, 8 ohm tap, distortion (%) vs 1kHz continuous output power into 4 ohms.
I measured how the MAC7200's distortion changed with frequency at 20V output, which is equivalent to 50W into 8 ohms and 100W into 4 ohms. The THD+N percentage was very low into both loads (fig.9) and didn't increase at the top of the audioband. As suspected from the clipping graphs, the measurement was being dominated by random noise, which can also be seen in the waveform of the THD+N spuriae (fig.10). A hint of second harmonic can be just made out in this graph, which was confirmed by spectral analysis (fig.11). Intermodulation distortion was also vanishingly low (fig.12).
Fig.9 McIntosh MAC7200, 8 ohm tap, THD+N (%) vs frequency at 20V into 8 ohms (left blue, right red) and 4 ohms (left cyan, right magenta).
Fig.10 McIntosh MAC7200, 8 ohm tap, 1kHz waveform at 100W into 8 ohms, 0.0043% THD+N (top); distortion and noise waveform with fundamental notched out (bottom, not to scale).
Fig.11 McIntosh MAC7200, 8 ohm tap, spectrum of 50Hz sinewave, DC–1kHz, at 100W into 8 ohms (left channel blue, right red, linear frequency scale).
Fig.12 McIntosh MAC7200, 8 ohm tap, HF intermodulation spectrum, DC–30kHz, 19+20kHz at 100W peak into 8 ohms (linear frequency scale).
I primarily tested the McIntosh's phono input from the preamplifier output with the jumpers to the power amplifier inputs removed. The moving magnet and moving coil modes both preserved absolute polarity at all outputs in all modes. The MM input impedance was an appropriate 45k ohms at 20Hz and 1kHz, dropping to 39.6k ohms at 20kHz. The MC mode's input impedance had been set to 200 ohms; I measured 200.7 ohms from 20Hz to 20kHz. With the volume control set to its maximum, the MM mode offered 55.7dB of gain at the preamplifier output and 84.8dB at the 8 ohm loudspeaker output. The MC mode offered 20dB higher gain.
Fig.13 McIntosh MAC7200, phono input, MM mode, response with RIAA correction (left channel blue, right red, 0.5dB/vertical div.)
The MAC7200's phono input offered excellent overload margins, at >22.5dB ref. 1kHz at 5mV in MM mode and >20dB ref. 1kHz at 500µV in MC mode. The phono input's distortion was very low, primarily consisting of the second harmonic, but this lay at just –100dB (0.001%, fig.14). Intermodulation distortion via the MAC7200's phono input was also extremely low.
Fig.14 McIntosh MAC7200, phono input, MM mode, spectrum of 1kHz sinewave, DC–10kHz, at 10mV input (left channel blue, right red; linear frequency scale).
The McIntosh MAC7200's optical and coaxial S/PDIF digital inputs locked to data sampled up to 192kHz. Apple's USB Prober utility, running on my battery-powered MacBook Pro, identified the McIntosh as "McIntosh HD USB Audio\000..." from "McIntosh\000... ." The USB port operated in the optimal isochronous asynchronous mode, and Apple's AudioMIDI utility revealed that via USB the MAC7200 accepted 16-, 24-, and 32-bit integer data sampled at all rates from 32kHz to 384kHz.
With the volume control set to its maximum, a 1kHz digital signal at –20dBFS resulted in a level at the 8 ohm loudspeaker outputs of 34.64V into 8 ohms, which is equivalent to 150W into 8 ohms. As is often the case with integrated amplifiers with DACs, the MAC7200's digital inputs have too much gain. The –20dBFS digital signal resulted in a level of 1.252V at the preamplifier output and 2V at the headphone output. To avoid damaging the McIntosh's power amplifier stage with high-level digital signals, I performed all the measurements of the digital inputs' performance at the preamplifier output. As this output clips with full-scale digital signals with the volume control set to its maximum, I examined the behavior of the digital inputs with the volume control at 76%, a few dB below the setting at which the distortion started to rise. The preamplifier output level at this volume control setting was 3.15V.
Fig.15 McIntosh MAC7200, digital inputs, impulse response (one sample at 0dBFS, 44.1kHz sampling, 4ms time window).
Fig.16 McIntosh MAC7200, digital input, wideband spectrum of white noise at –4dBFS (left channel red, right magenta) and 19.1kHz tone at 0dBFS (left blue, right cyan), with data sampled at 44.1kHz (20dB/vertical div.).
Fig.17 McIntosh MAC7200, digital inputs, frequency response at –12dBFS into 100k ohms with data sampled at: 44.1kHz (left channel green, right gray), 96kHz (left channel cyan, right magenta), 192kHz (left blue, right red) (1dB/vertical div.).
Channel separation via the digital inputs was a very good 90dB below 1kHz. When I increased the bit depth from 16 to 24 with a dithered 1kHz tone at –90dBFS (fig.18), the noise floor components dropped by around 18dB, which implies that the MAC7200 offers around 19 bits' worth of resolution. With undithered data representing a tone at exactly –90.31dBFS (not shown), the three DC voltage levels described by the data were well resolved. With undithered 24-bit data (also not shown), the result was a fairly clean sinewave.
Fig.18 McIntosh MAC7200, digital inputs, spectrum with noise and spuriae of dithered 1kHz tone at –90dBFS with: 16-bit data (left channel cyan, right magenta), 24-bit data (left blue, right red) (20dB/vertical div.).
Fig.19 McIntosh MAC7200, digital inputs, HF intermodulation spectrum, DC–30kHz, 19+20kHz at 0dBFS peak(linear frequency scale).
Fig.20 McIntosh MAC7200, digital input, high-resolution jitter spectrum of analog output signal, 11.025kHz at –6dBFS, sampled at 44.1kHz with LSB toggled at 229Hz: 16-bit Toslink data (left channel blue, right red). Center frequency of trace, 11.025kHz; frequency range, ±3.5kHz.
Footnote 1: This scalloping of the noise floor is probably not audible as such, However, it is always suspicious when a product's transfer function is modified by the signal.


