Sidebar 3: Measurements
The center of the Perlisten S7t's DPC high-frequency driver array is just 32" from the floor. While the distributor had placed the loudspeaker on a 3"-high dolly when he delivered it, I wasn't able to lift the speaker any higher for the measurements. (It weighs 122.5lb.) I therefore performed my farfield frequency response measurements at 1m rather than my usual 50" in order to push the reflections from the floor as far back in time as possible.
(I allowed for the slight tiltback of the loudspeaker's front baffle, to ensure that the microphone was on the central tweeter axis, and I didn't use the vestigial grille.) I used DRA Labs' MLSSA system, an Earthworks microphone preamplifier, and a calibrated DPA 4006 microphone to measure the Perlisten S7t's farfield behavior, and an Earthworks QTC-40 mike for the nearfield responses.
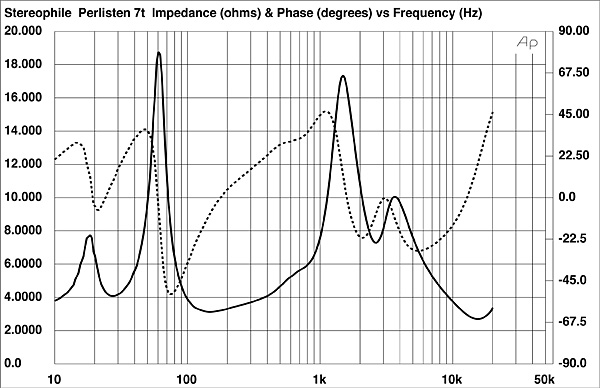
Perlisten specifies the S7t's sensitivity as a high 92.2dB/2.83V/m, which was confirmed by my B-weighted measurement. The S7t's impedance is specified as 4 ohms nominal, with a minimum magnitude of 3.2 ohms. Using Dayton Audio's DATS V2 system, I found that the impedance magnitude (fig.1, solid trace) remained above 4 ohms for much of the audioband with minimum values of 3.125 ohms at 147Hz and 2.47 ohms between 14.5kHz and 16.3kHz. The electrical phase angle (dashed trace) is occasionally high when the magnitude is low. For example, there is a combination of 4.7 ohms and –45° at 88Hz, a frequency where music can have a high level of energy. The EPDR1 drops to 2.2 ohms between 32Hz and 39Hz, 1.5 ohms between 93Hz and 111Hz, and 1 ohm at 20kHz. The EPDR also lies below 3 ohms for the entire midrange. The S7t should be used with amplifiers that don't have problems driving 2 ohm loads, though the drive difficulty will be alleviated by the speaker's high sensitivity.
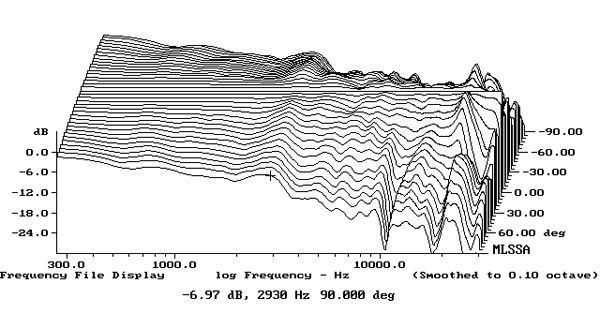
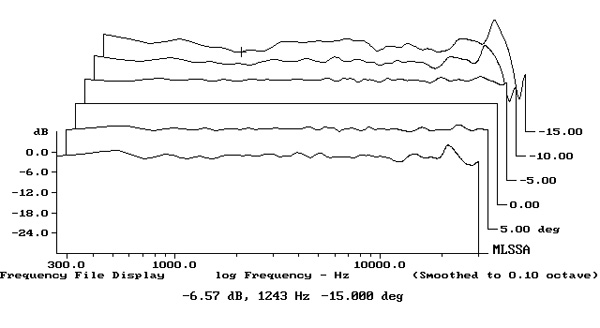
 The S7t's horizontal dispersion is shown in fig.5. (The traces are normalized to the response on the tweeter axis, which thus appears as a straight line.) Other than a slight off-axis flare in the presence region, the loudspeaker's radiation pattern is smooth and even up to 6kHz. Above that frequency, the DPC array's radiation pattern starts to narrow, which might make the speaker sound a little airless in very large rooms. The Perlisten's vertical dispersion, again normalized to the response on the tweeter axis, is shown in fig.6. The loudspeaker's balance doesn't change appreciably over a wide ±10° window, though a suckout at the crossover frequency starts to develop 15° above the tweeter axis. Don't listen to this speaker while standing.
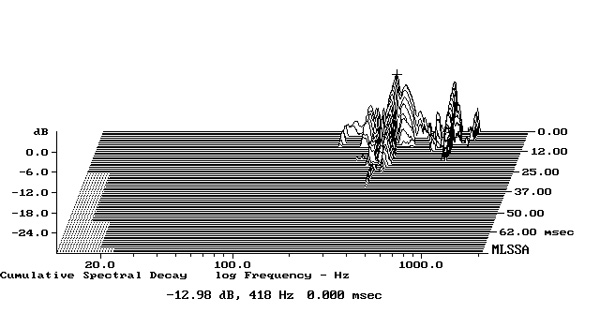
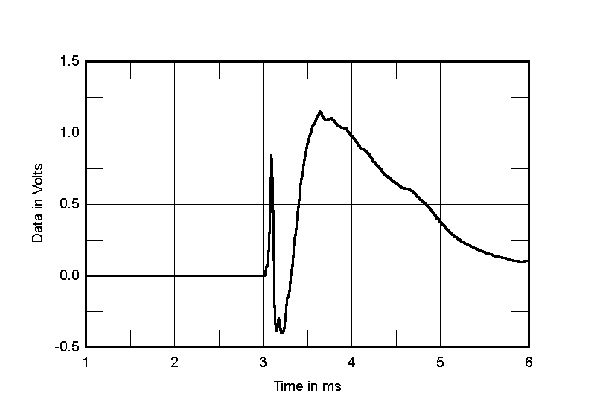
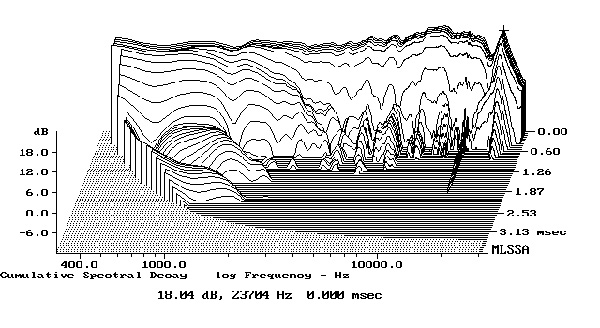
 In the time domain, the S7t's step response on the tweeter axis (fig.7) reveals that all the drive-units are connected in positive acoustic polarity. The decay of the DPC array's step smoothly blends with the positive-going start of the woofers' step, which implies optimal implementation of the crossover filters. The S7t's cumulative spectral-decay plot (fig.8) is superbly clean, especially in the region covered by the DPC array.
Footnote 1: EPDR is the resistive load that gives rise to the same peak dissipation in an amplifier's output devices as the loudspeaker. See "Audio Power Amplifiers for Loudspeaker Loads," JAES, Vol.42 No.9, September 1994, and stereophile.com/reference/707heavy/index.html.
Fig.1 Perlisten S7t, electrical impedance (solid) and phase (dashed) (2 ohms/vertical div.).
The traces in fig.1 are free from the small discontinuities in the midrange that would imply resonances of some kind. When I investigated the enclosure's vibrational behavior with a plastic-tape accelerometer, I found a couple of resonant modes in the midrange (fig.2). However, these are low in level and have a relatively high Q (Quality Factor), both of which imply that they will not affect sound quality.
Fig.2 Perlisten S7t, cumulative spectral-decay plot calculated from output of accelerometer fastened to center of sidewall level with the second woofer from the top (MLS driving voltage to speaker, 7.55V; measurement bandwidth, 2kHz).
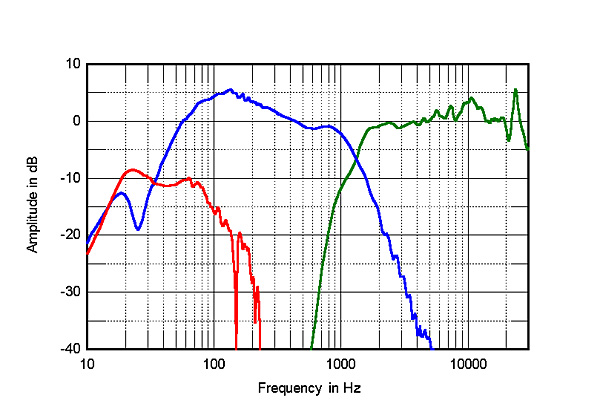
The saddle centered on 27Hz in the impedance magnitude trace suggests that this is the tuning frequency of the reflex-loaded woofers. The red trace in fig.3 shows the nearfield response measured at one of the vents at the speaker's base. There is a broad peak centered on 27Hz but also significant output in the midbass region before the response rolls off steeply above 80Hz. The blue trace below 350Hz is the summed nearfield response of the four woofers. Although the information sheet on Perlisten's website says that the woofers can be operated with the reflex ports open or closed, all four woofers behaved identically, with a minimum-motion notch at the port tuning frequency, which indicates that the ports were open. The boost in the upper bass is an artifact of the nearfield measurement technique, which assumes that the radiators are mounted in a true infinite baffle, ie, one that extends to infinity in both planes. When corrected for this, the woofer's upper- and mid-bass output will be flat.
Fig.3 Perlisten S7t, acoustic crossover on tweeter axis at 1m, corrected for microphone response, with the nearfield response of the ports (red) and the summed nearfield responses of the woofers (blue), respectively plotted below 220Hz and 350Hz.
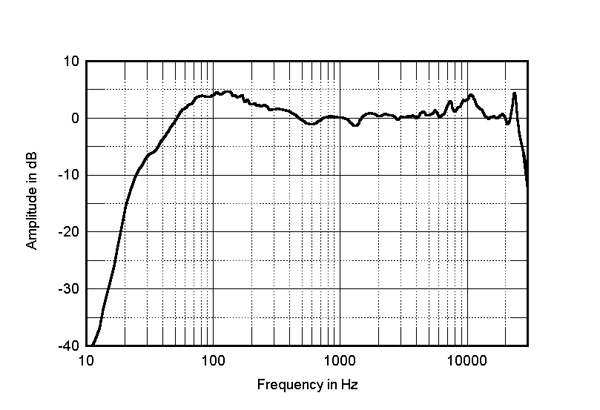
The blue trace above 350Hz in fig.3 shows the farfield response of the woofers. The woofers at the top and bottom of the front baffle start rolling off above 600Hz, but the two woofers closest to the DPC array cross over to the farfield output of the array (green trace) at 1.4kHz, with then a steep, 18dB/octave rolloff. The DPC array rolls in steeply with what appears to be a 24dB/octave slope. Its output is flat in the low and mid-treble, though a slight peak is apparent at 10kHz. The tweeter's fundamental dome response can be seen at 23.7kHz, safely above the audioband. Fig.4 shows the S7t's farfield response averaged across a 30° horizontal window centered on the tweeter axis. The nearfield bump in the upper bass is present, but overall the response is impressively even in the midrange through to 7kHz or so. There weren't any significant differences when I repeated this measurement with the grille covering the DPC array (not shown).
Fig.4 Perlisten S7t, anechoic response on tweeter axis at 1m, averaged across 30° horizontal window and corrected for microphone response, with the complex sum of the nearfield responses plotted below 300Hz.
Fig.5 Perlisten S7t, lateral response family at 1m, normalized to response on tweeter axis, from back to front: differences in response 90–5° off axis, reference response, differences in response 5–90° off axis.
Fig.6 Perlisten S7t, vertical response family at 1m, normalized to response on tweeter axis, from back to front: differences in response 15–5° above axis, reference response, differences in response 5–10° below axis.
Fig.7 Perlisten S7t, step response on tweeter axis at 1m (5ms time window, 30kHz bandwidth).
Fig.8 Perlisten S7t, cumulative spectral-decay plot on tweeter axis at 1m (0.15ms risetime).
To say that I was impressed by the Perlisten S7t's measured performance would be an understatement. It typifies excellent loudspeaker engineering.—John Atkinson
Footnote 1: EPDR is the resistive load that gives rise to the same peak dissipation in an amplifier's output devices as the loudspeaker. See "Audio Power Amplifiers for Loudspeaker Loads," JAES, Vol.42 No.9, September 1994, and stereophile.com/reference/707heavy/index.html.