Sidebar 4: Measurements
I used DRA Labs' MLSSA system and a calibrated DPA 4006 microphone to measure the Q Acoustics Concept 300's frequency response in the farfield, and an Earthworks QTC-40 mike for the nearfield and in-room responses.
Q Acoustics specifies the Concept 300's sensitivity as 84dB/W/m. My estimate was slightly higher, at 86dB(B)/2.83V/m. The Concept 300's impedance is specified as 6 ohms, with a minimum value of 3.7 ohms (on the website) or 4.7 ohms (in the product's white paper). My impedance measurements, which I took with MLSSA then checked with Dayton Audio's DATS V2 system, tell a different story. The impedance magnitude (fig.1, solid trace) only drops below 6 ohms in the lower midrange and above 10kHz. The minimum magnitude—4.9 ohms between 175Hz and 200Hz—is higher than both specified values. Though the electrical phase angle (dashed trace) reaches –57° at 90Hz and +54.5° at 23Hz, the magnitude at those frequencies is high, mitigating any drive difficulty. The Q Acoustics is not a particularly demanding load to drive. With the port sealed, the impedance has a single peak in the bass (fig.2), indicating that the Concept 300 behaves as a sealed box tuned to a relatively high 67Hz.


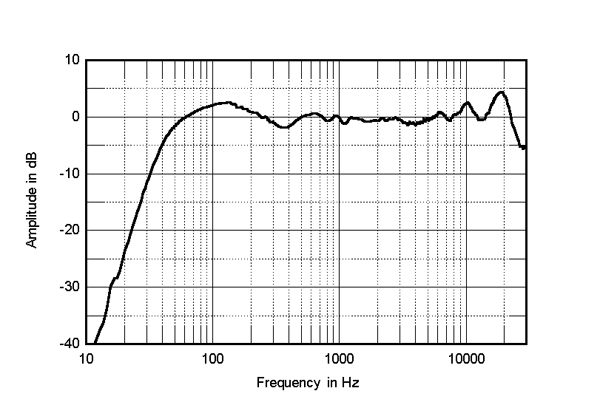
 The black trace below 300Hz in fig.6 shows the sum of the Concept 300's nearfield woofer and port outputs, taking into account acoustic phase and the different distance of each radiator from a nominal farfield microphone position. The output is down by 6dB at the port tuning frequency, below which the speaker rolls off with the usual 24dB/octave reflex slope. The Q Acoustics' farfield response, averaged across a 30° horizontal window centered on the tweeter axis, is shown as the black trace above 300Hz in fig.6. The balance is superbly flat and even up to the mid-treble, above which there is a very slight rising trend. This graph was taken with the Concept 300's rear-panel jumper set to Normal. Changing the jumper settings as indicated in the manual raised or lowered the level by exactly 0.5dB, as specified. The frequency responses of the two Q Acoustics Concept 300s matched very closely.

Footnote 1: See fig.4 here.
Fig.1 Q Acoustics Concept 300, electrical impedance (solid) and phase (dashed) with port open (2 ohms/vertical div.).
Fig.2 Q Acoustics Concept 300, electrical impedance (solid) and phase (dashed) with port blocked (2 ohms/vertical div.).
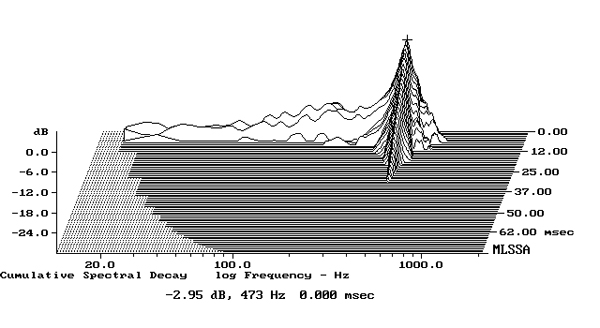
I measured the Concept 300's impedance first with it supported by upturned cones at the corners of the enclosure, then with it sitting on the Tensegrity stand. I didn't find any differences. The very slight discontinuity between 400Hz and 500Hz in the impedance traces, which suggests there is a panel resonance in that region, was the same with both measurements. However, when I investigated the enclosure's vibrational behavior with a plastic-tape accelerometer, I found that a fairly high-level mode at 473Hz on the sidewalls with the speaker mounted on upturned cones (fig.3) was reduced by 5.4dB when the speaker was placed on its dedicated stand (fig.4). This mode was the only one present on any of the panels; it is sufficiently high in frequency and Q (Quality Factor) that even without the attenuation provided by the speaker's sprung base, it probably wouldn't have any audible effects.
Fig.3 Q Acoustics Concept 300, cumulative spectral-decay plot calculated from output of accelerometer fastened to center of sidewall with speaker supported on upturned cones (MLS driving voltage to speaker, 7.55V; measurement bandwidth, 2kHz).
Fig.4 Q Acoustics Concept 300, cumulative spectral-decay plot calculated from output of accelerometer fastened to center of sidewall with speaker sitting on its dedicated stand (MLS driving voltage to speaker, 7.55V; measurement bandwidth, 2kHz).
The port on the Q Acoustics' rear panel is tuned to 44Hz, this indicated by the fact that the impedance-magnitude plot has a saddle centered on that frequency. The blue trace in fig.5, which shows the woofer's nearfield response, has its minimum-motion notch at 44Hz. (This is the frequency at which the back pressure from the port resonance holds the cone stationary.) The nearfield response of the port (red trace) peaks between 30Hz and 60Hz; while its upper-frequency rolloff is clean, there is a significant peak just above 800Hz. The woofer's output has a slight peak in the upper bass, which will be due in part to the nearfield measurement technique, which assumes the drive-unit is firing into half-space rather than in all directions. The woofer's balance is flat before it starts to cross over to the tweeter (green trace) just below the specified 2.5kHz. The crossover appears to be configured with symmetrical, ultimate 18dB/octave slopes. (Each drive-unit's rollout is slower than that for an octave or so below and above the crossover frequency.) The tweeter's response appears identical to that used in the floorstanding Concept 500 (footnote 1).
Fig.5 Q Acoustics Concept 300, acoustic crossover on tweeter axis at 50", corrected for microphone response, with nearfield woofer (blue) and port (red) responses respectively plotted below 350Hz, 1kHz.
Fig.6 Q Acoustics Concept 300, anechoic response on tweeter axis at 50", averaged across 30° horizontal window and corrected for microphone response, with the complex sum of the nearfield woofer and port responses plotted below 300Hz.
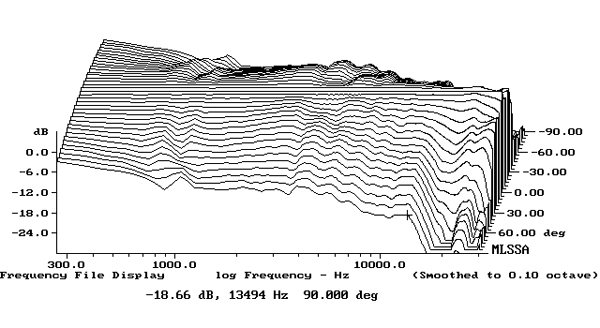
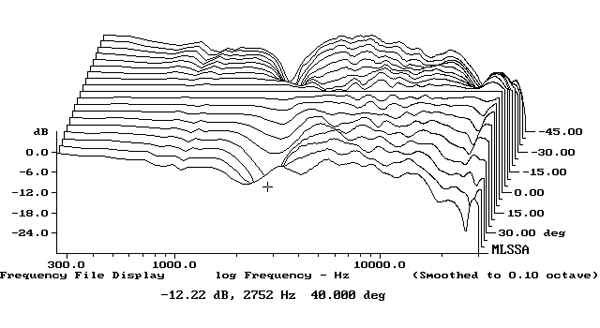
Fig.7 shows the Q Acoustics' horizontal dispersion, referenced to the response on the tweeter axis, which thus appears as a straight line. Other than a very slight flare at the bottom of the tweeter's passband, the contour lines in this graph are even throughout the midrange and treble, implying stable stereo imaging. This graph also shows that the Concept 300 becomes quite directional in the top audio octave, which will work against the audibility of the small peak in the same region in the on-axis response in all but very small rooms. In the vertical plane (fig.8), a suckout develops in the crossover region 10° above and 15° below the woofer axis. The Q Acoustics speaker will sound at its best with the listener's ears level with the tweeter. Fortunately, the Tensegrity stand places the Concept 300's tweeter 36" from the floor, which a 1990s survey by my colleague Thomas J. Norton indicated was the average ear height for listeners sitting in regular chairs (but not in folding "director" chairs).
Fig.7 Q Acoustics Concept 300, lateral response family at 50", normalized to response on tweeter axis, from back to front: differences in response 90–5° off axis, reference response, differences in response 5–90° off axis.
Fig.8 Q Acoustics Concept 300, vertical response family at 50", normalized to response on tweeter axis, from back to front: differences in response 45–5° above axis, reference response, differences in response 5–45° below axis.
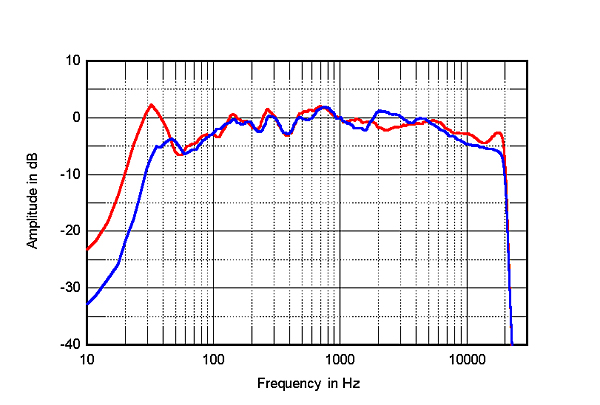
The red trace in fig.9 shows the Concept 300s' spatially averaged response with the grilles on in my room. This is generated by averaging 20 1/6-octave–smoothed spectra, taken for the left and right speakers individually using a 96kHz sample rate, in a vertical rectangular grid 36" wide 18" high and centered on the positions of my ears. For reference, the blue trace shows the spatially averaged response of the KEF LS50s I purchased following my review in 2012. The in- room response of both loudspeakers is very similar in the midrange, with a slight rising trend evident between 150Hz and 800Hz. Both roll off slowly below 100Hz, but the Concept 300s excite the lowest-frequency mode in my room at 32Hz to a significantly greater extent than the KEFs. At the other end of the spectrum, the slightly sloped-down output of both speakers is due to the increased absorptivity of the room's furnishings as the frequency rises. While the LS50s have more presence-region energy than the Concept 300s, the latter have more output in the top two octaves of the audioband. (The in-room responses of both speakers drop like a stone above 20kHz; this is because I performed the measurements using the NAD M10 amplifier, which digitizes its analog inputs with a 44.1kHz sample rate.)
Fig.9 Q Acoustics Concept 300, spatially averaged, 1/6-octave response in JA's listening room (red) and of the KEF LS50 (blue).
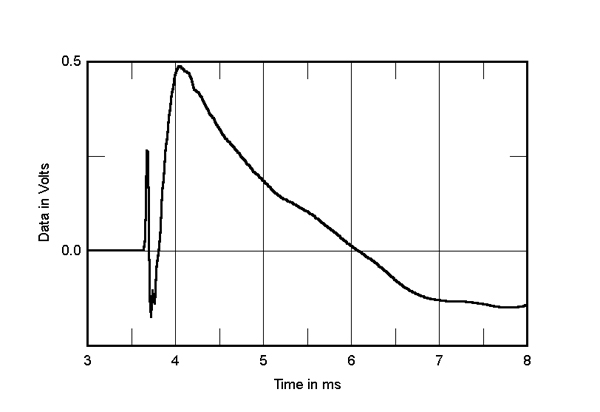
Turning to the time domain, the Concept 300's step response (fig.10) indicates that the tweeter and midrange unit are connected in positive acoustic polarity. The decay of the tweeter's step, which arrives first at the microphone, smoothly blends with the start of the woofer's step. This implies optimal crossover implementation. The Q Acoustics Concept 300's cumulative spectral-decay plot (fig.11) is superbly clean overall, cleaner even than that of the Concept 500. This may well correlate with the extremely transparent window the pair of Q Acoustic speakers offered into recorded spaces.
Fig.10 Q Acoustics Concept 300, step response on tweeter axis at 50" (5ms time window, 30kHz bandwidth).
Fig.11 Q Acoustics Concept 300, cumulative spectral-decay plot on tweeter axis at 50" (0.15ms risetime).
The Q Acoustics Concept 300 offers excellent measured performance, indicative of equally excellent loudspeaker engineering.—John Atkinson
Footnote 1: See fig.4 here.


