Sidebar 3: Measurements
I measured the T+A MP 3100 HV with my Audio Precision SYS2722 system (see the January 2008 "As We See It"). Looking first at the MP 3100 HV as a disc player, its error correction was the best I have encountered—there were no glitches in its output with any of the gaps in the data spiral on the Pierre Verany Digital Test CD. The optical and coaxial S/PDIF inputs and the AES/EBU input locked to datastreams with sample rates up to 192kHz. Apple's USB Prober utility identified the processor as "MP 3100 HV HD-Audio" from "T+A elektroakustik" and indicated that the T+A's USB port operated in the optimal isochronous asynchronous mode. Apple's AudioMIDI utility revealed that, via USB, the MP 3100 HV accepted 32-bit integer data sampled at all rates from 32 to 384kHz.
The maximum output level varied according to which input was selected. Playing a 1kHz tone at 0dBFS on a test SACD resulted in an output level of 4.964V, balanced, and 2.483V, unbalanced, both into 100k ohms and confirming the specified levels. With the USB, S/PDIF, and AES/EBU inputs, the maximum output levels at 1kHz were 0.36dB lower, at 4.752V, balanced, and 2.375V, unbalanced. The maximum output levels playing a CD were lower still, at 4.038V and 2.018V, though the latter does conform to the Red Book standard. Both sets of outputs preserved absolute polarity with all inputs. The unbalanced output impedance is specified as 50 ohms. I measured 45.7 ohms at 20kHz and 1kHz, increasing very slightly to 54.5 ohms at 20Hz. The balanced output impedances were exactly twice the unbalanced values, as expected.
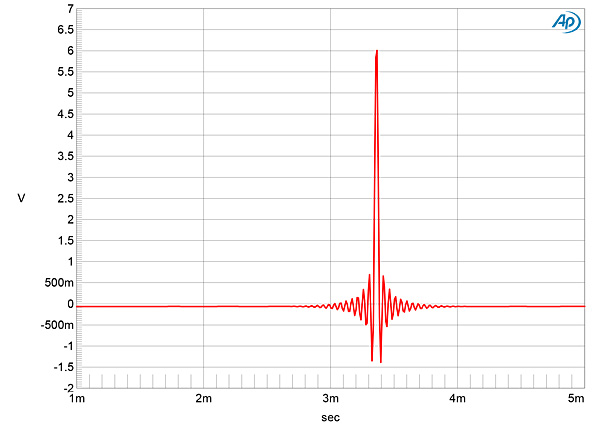
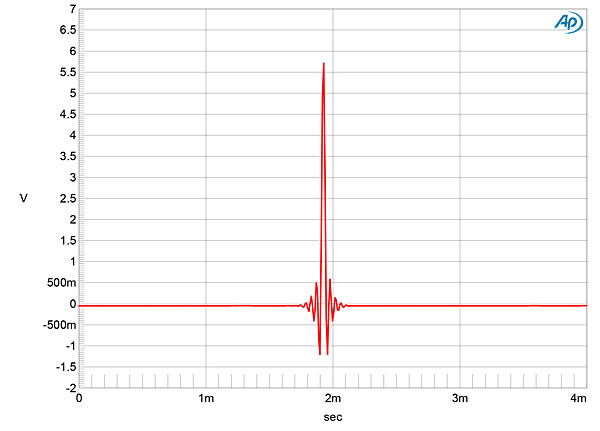
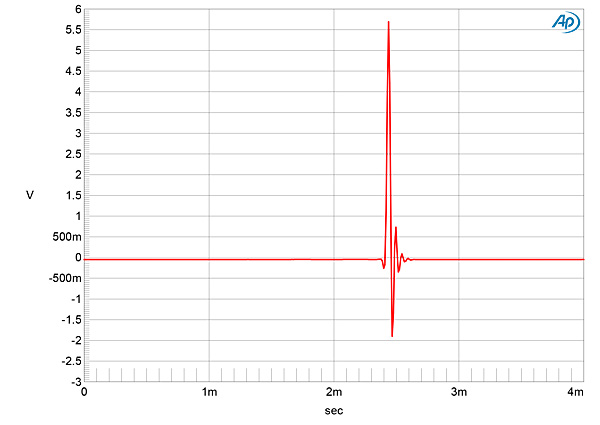
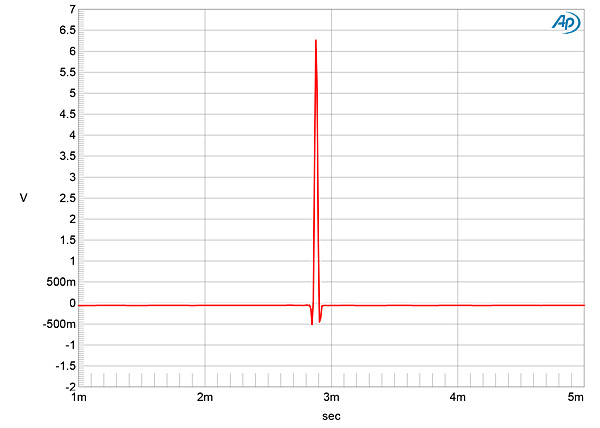
The four oversampling digital reconstruction filters are labeled FIR Long, FIR Short, Bezier IIR, and Bezier. The FIR Long filter had a conventional time-symmetrical linear-phase impulse response with 44.1kHz data (fig.1); the FIR Short filter, as its name suggests, is shorter (fig.2). With the Bezier IIR filter selected, which I understand was used by Jim Austin for most of his auditioning, the T+A's impulse response had a single cycle of preringing and two of postringing (fig.3). The Bezier filter offered an almost time-perfect symmetrical pulse (fig.4).
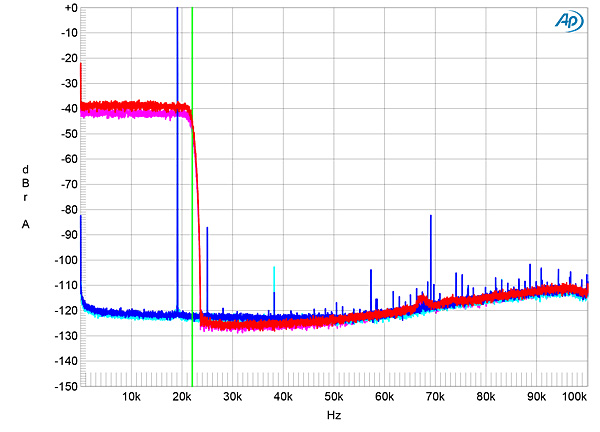
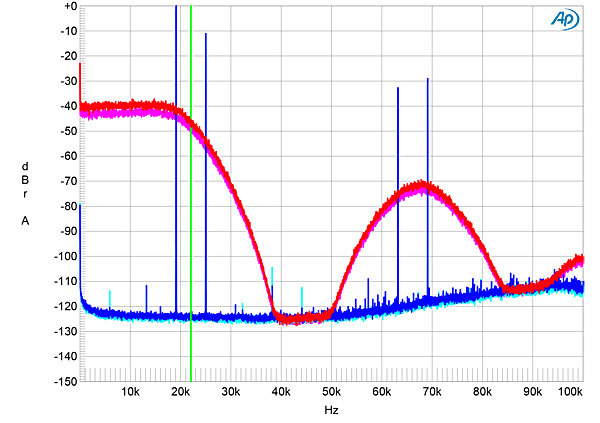
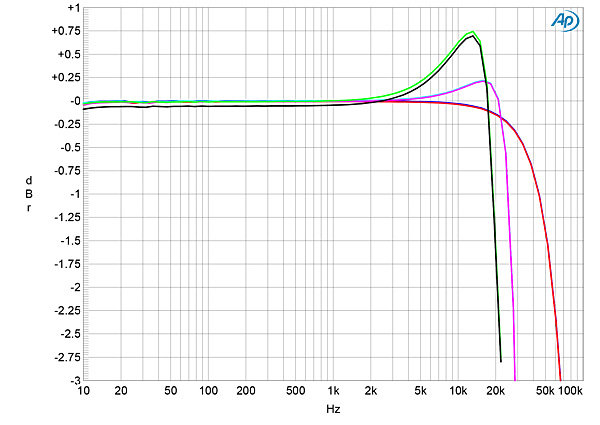
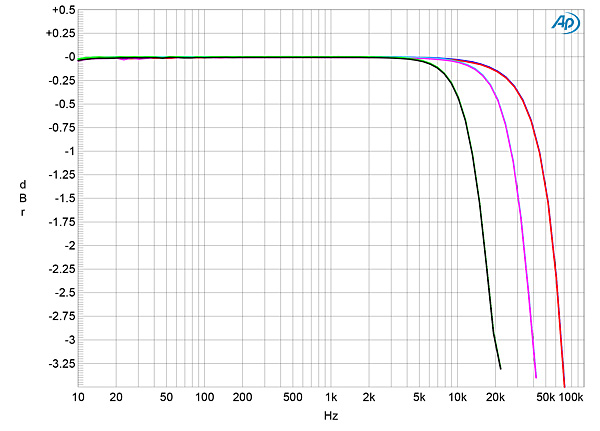
 The Bezier IIR filter was peculiar, in that a small, 0.75dB-high peak was present with 44.1kHz data (fig.8, green and gray traces). The peak was lower in amplitude and higher in frequency with 96kHz data (cyan and magenta traces), and was absent with 192kHz data (blue and red traces). The Bezier filter started rolling off earlier than the other filters and was down by 3dB just below half of each sample rate (fig.9), suggesting that it resembles the slow-rolloff filters first seen in the 1990s with products from Wadia and Pioneer.
 The T+A's channel separation was superb, at >125dB in both directions below 1kHz and still 113dB at the top of the audioband. When I increased the bit depth from 16 to 24 with a dithered 1kHz tone at –90dBFS (fig.10), the random noise floor dropped by around 22dB, meaning that the MP 3100 HV offers almost 20 bits' worth of resolution, which is enough to give a clean spectrum with a dithered tone at a roots-of-the-universe –120dBFS (fig.11). With undithered 16-bit data representing a tone at exactly –90.31dBFS, the three DC voltage levels described by the data were perfectly resolved (fig.12). With undithered 24-bit data, the result was an excellent sinewave (fig.13)
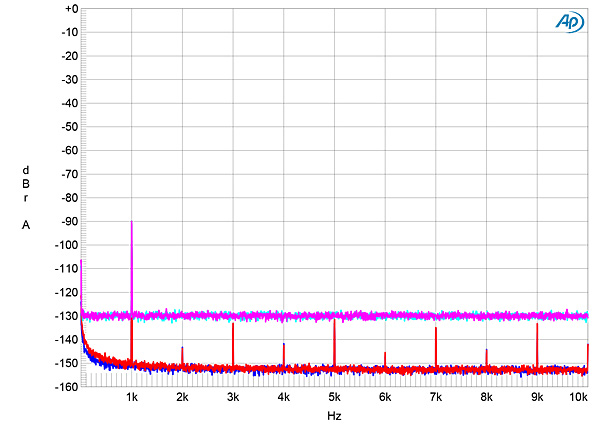
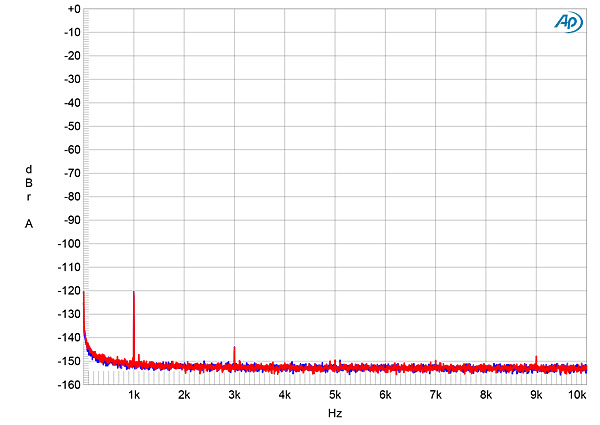
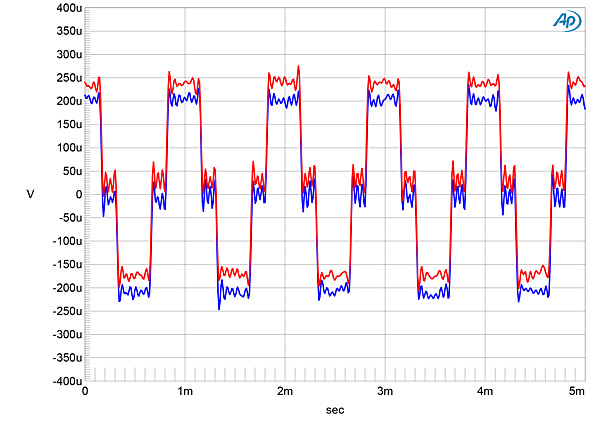
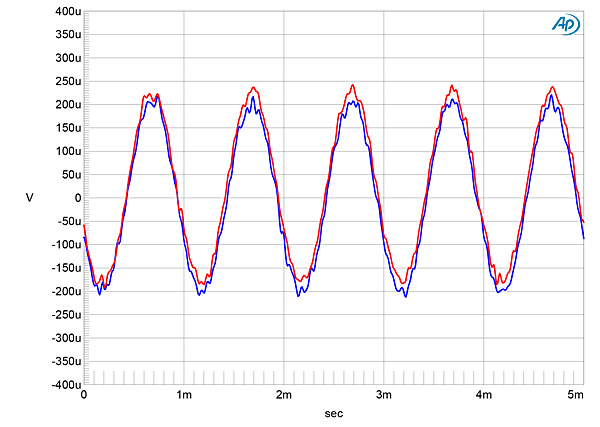
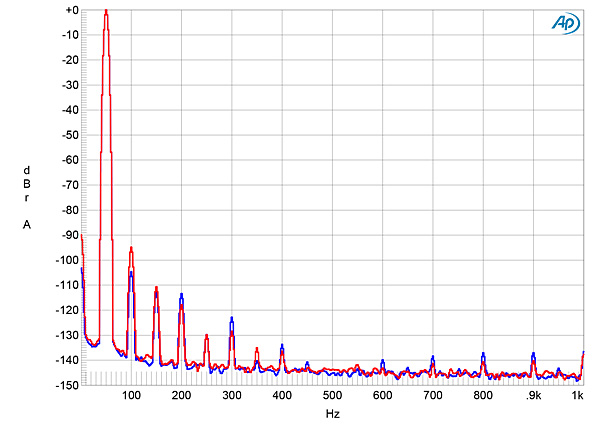
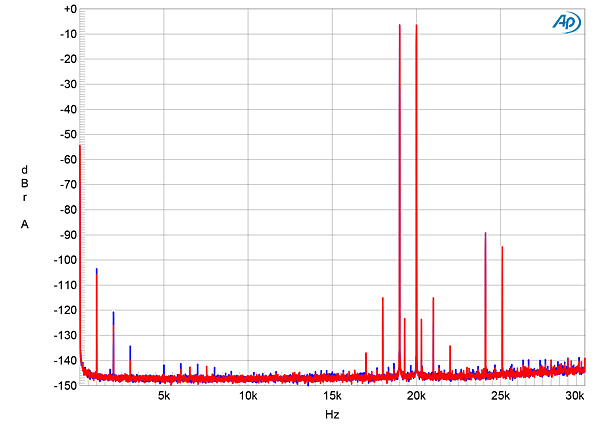
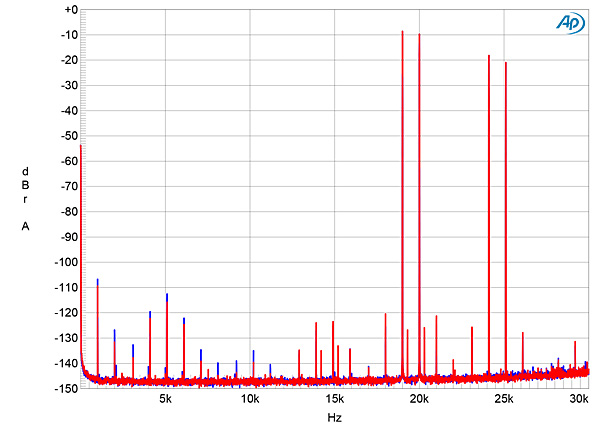
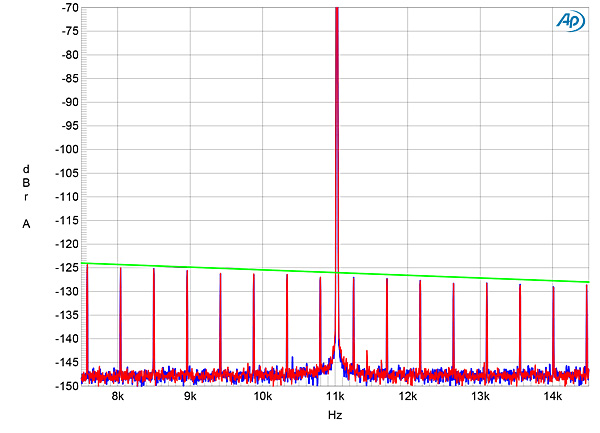
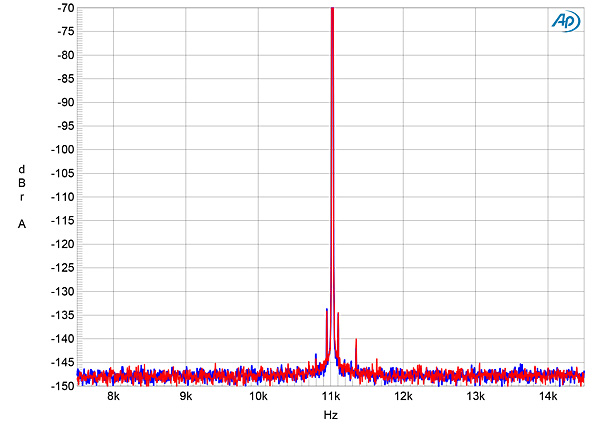
Fig.1 T+A MP 3100 HV, FIR Long filter, impulse response (one sample at 0dBFS, 44.1kHz sampling, 4ms time window).
Fig.2 T+A MP 3100 HV, FIR Short filter, impulse response (one sample at 0dBFS, 44.1kHz sampling, 4ms time window).
Fig.3 T+A MP 3100 HV, Bezier IIR filter, impulse response (one sample at 0dBFS, 44.1kHz sampling, 4ms time window).
Fig.4 T+A MP 3100 HV, Bezier filter, impulse response (one sample at 0dBFS, 44.1kHz sampling, 4ms time window).
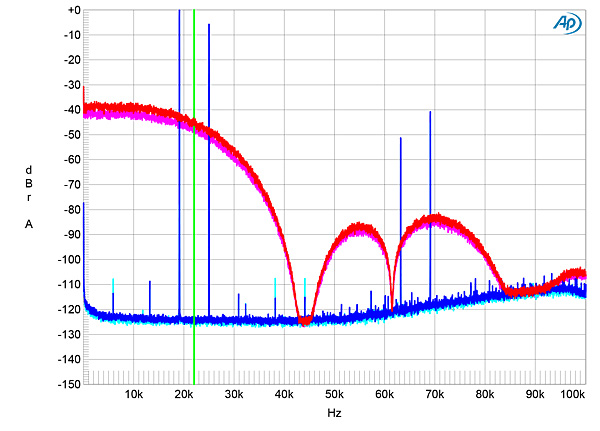
With 44.1kHz-sampled white noise, the T+A's response with the FIR Long filter featured a fast rolloff above the audioband (fig.5, red and magenta traces), with the aliased image at 25kHz of a full-scale 19.1kHz tone (blue and cyan traces) suppressed by almost 100dB. The FIR Short filter didn't reach full stop-band attenuation until 28kHz and the Bezier IIR filter until 39kHz (fig.6, red and magenta traces), with the aliased image of the 19.1kHz tone (blue and cyan traces) down by just 12dB. An unusual sculpting of the ultrasonic noise floor, centered on 70kHz, can be seen with the white noise signal. The Bezier filter offered an even slower ultrasonic rolloff (fig.7).
Fig.5 T+A MP 3100 HV, FIR Long filter, wideband spectrum of white noise at –4dBFS (left channel red, right magenta) and 19.1kHz tone at 0dBFS (left blue, right cyan) into 100k ohms with data sampled at 44.1kHz (20dB/vertical div.).
Fig.6 T+A MP 3100 HV, Bezier IIR filter, wideband spectrum of white noise at –4dBFS (left channel red, right magenta) and 19.1kHz tone at 0dBFS (left blue, right cyan) into 100k ohms with data sampled at 44.1kHz (20dB/vertical div.).
Fig.7 T+A MP 3100 HV, Bezier filter, wideband spectrum of white noise at –4dBFS (left channel red, right magenta) and 19.1kHz tone at 0dBFS (left blue, right cyan) into 100k ohms with data sampled at 44.1kHz (20dB/vertical div.).
With the two FIR filters and data sampled at 44.1kHz, the MP 3100 HV's frequency response was flat almost up to 20kHz, with then a sharp rolloff just below half the sample rate (not shown). At higher sample rates, these two filters were flat to 20kHz but started rolling off before half of each sample rate. (I had the analog low-pass filter set to Normal for the testing.)
Fig.8 T+A MP 3100 HV, Bezier IIR filter, frequency response at –12dBFS into 100k ohms with data sampled at: 44.1kHz (left channel green, right gray), 96kHz (left channel cyan, right magenta), 192kHz (left blue, right red) (0.5dB/vertical div.).
Fig.9 T+A MP 3100 HV, Bezier filter, frequency response at –12dBFS into 100k ohms with data sampled at: 44.1kHz (left channel green, right gray), 96kHz (left channel cyan, right magenta), 192kHz (left blue, right red) (0.5dB/vertical div.).
Fig.10 T+A MP 3100 HV, FIR Long filter, spectrum with noise and spuriae of dithered 1kHz tone at –90dBFS with: 16-bit data (left channel cyan, right magenta), 24-bit data (left blue, right red) (20dB/vertical div.).
Fig.11 T+A MP 3100 HV, spectrum with noise and spuriae of dithered 1kHz tone at –120dBFS with 24-bit data (left channel blue, right red) (20dB/vertical div.).
Fig.12 T+A MP 3100 HV, FIR Long filter, waveform of undithered 16-bit, 1kHz sinewave at –90.31dBFS (left channel blue, right red).
Fig.13 T+A MP 3100 HV, FIR Long filter, waveform of undithered 24-bit, 1kHz sinewave at –90.31dBFS (left channel blue, right red).
The T+A MP 3100 HV offered very low levels of harmonic distortion into high impedances. With a full-scale 50Hz tone, the second harmonic was the highest at level, but at –104dB in the left channel (fig.14, blue trace) and –96dB in the right channel (red trace), these are inconsequential. Higher-order harmonics all lay below –110dB (0.0003%). However, the output clipped with the balanced outputs driving a full-scale tone into 600 ohms. I had to reduce the signal level to –6dBFS to reduce the levels of the distortion harmonics to below –90dB (0.003%) into this very demanding load.
Fig.14 T+A MP 3100 HV, spectrum of 50Hz sinewave, DC–1kHz, at 0dBFS into 100k ohms (left channel blue, right red; linear frequency scale).
While the T+A's intermodulation distortion was very low in level, the second-order difference product produced by equal-level tones at 19 and 20kHz with the combined waveform peaking at 0dBFS lying around –104dB (0.0006%), the suppression of the ultrasonic aliased images of these tones depended on the digital reconstruction filter in use. While the aliased tones were attenuated by 90dB or more with the FIR Long filter (fig.15), the Bezier IIR filter suppressed them by around 20dB (fig.16) and aliased images appeared in the audioband, though these are still at a very low level.
Fig.15 T+A MP 3100 HV, FIR Long filter, HF intermodulation spectrum, DC–30kHz, 19+20kHz at 0dBFS into 100k ohms, 44.1kHz data (left channel blue, right red; linear frequency scale).
Fig.16 T+A MP 3100 HV, Bezier IIR filter, HF intermodulation spectrum, DC–30kHz, 19+20kHz at –6dBFS into 100k ohms, 44.1kHz data (left channel blue, right red; linear frequency scale).
When I tested the T+A processor for its rejection of word-clock jitter with 16-bit TosLink J-Test data, all the odd-order harmonics of the LSB-level, low-frequency squarewave were at the correct levels (fig.17, sloping green line). No sidebands were visible when I repeated the jitter test with 24-bit optical J-Test data, but a very low-level pair of sidebands appeared at ±80Hz with 24-bit USB data (fig.18), these of unknown origin but most likely inconsequential.
Fig.17 T+A MP 3100 HV, high-resolution jitter spectrum of analog output signal, 11.025kHz at –6dBFS, sampled at 44.1kHz with LSB toggled at 229Hz: 16-bit optical data (left channel blue, right red). Center frequency of trace, 11.025kHz; frequency range, ±3.5kHz.
Fig.18 T+A MP 3100 HV, high-resolution jitter spectrum of analog output signal, 11.025kHz at –6dBFS, sampled at 44.1kHz with LSB toggled at 229Hz: 24-bit USB data (left channel blue, right red). Center frequency of trace, 11.025kHz; frequency range, ±3.5kHz.
The T+A MP 3100 HV did well on the test bench, though those rare preamplifiers with an input impedance of less than 1k ohms should be avoided.—John Atkinson