Sidebar 3: Measurements
I measured the second sample of the Cambridge Audio Azur 851A (serial no. FE C10427K 1205 0137) using my recently recalibrated Audio Precision SYS2722 system (see www.ap.com, and the January 2008 "As We See It"). Before performing any measurements on an amplifier, I run it for an hour at one-third its specified maximum power, which, thermally, is the worst case for an amplifier with a class-B or -AB output stage. I cut short this preconditioning with the Cambridge 851A after 30 minutes, however, because its case was getting very hot—the top-panel grille over the internal heatsinks was too hot to touch, at 148.4°F (64.7°C)—and I was concerned that something might break. I don't believe this will be a problem in normal use, as long as the amplifier is given plenty of space for ventilation.
As set-up, the maximum voltage gain into 8 ohms for the unbalanced inputs was 38.9dB, which is typical for an integrated amplifier. For balanced inputs, however, the maximum gain was exactly 6dB lower. All inputs preserved absolute polarity; ie, were non-inverting. The input impedance was close to specification, at 19.5k ohms across the audioband for the unbalanced inputs and for each phase of the balanced inputs.
The output impedance was very low, at 0.07 ohm (including 6' of speaker cable) in the bass and midrange, rising to 0.1 ohm at the top of the audioband. With this low impedance, there is just ±0.1dB of variation in the amplifier's frequency response when driving our standard simulated loudspeaker (fig.1, gray trace). This graph was taken with the amplifier in Direct mode, bypassing the tone controls, and with the volume control set to its maximum. Reducing the volume control to an indicated –12dB on the front-panel display didn't change the Azur 851A's response, and the amplifier has a very wide small-signal bandwidth into 8 ohms (blue and red traces). The response is –1.75dB at the 200kHz limit of this graph, and even into 2 ohms (fig.1, green trace), the response is down by less than 0.2dB at the top of the audioband. This gives a 10kHz squarewave very short risetimes (fig.2), and, commendably, there is no trace of overshoot or ringing. The 851A's reproduction of a 1kHz squarewave (fig.3) was essentially perfect.

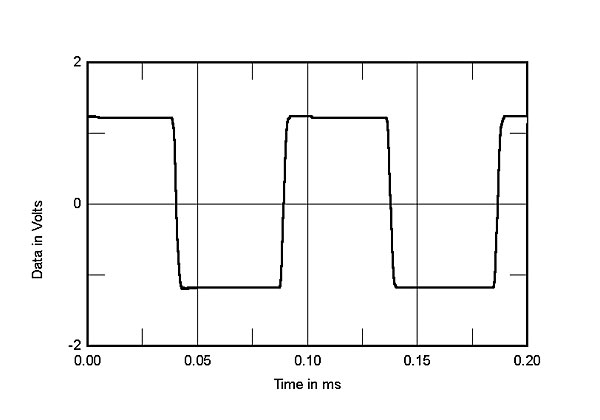
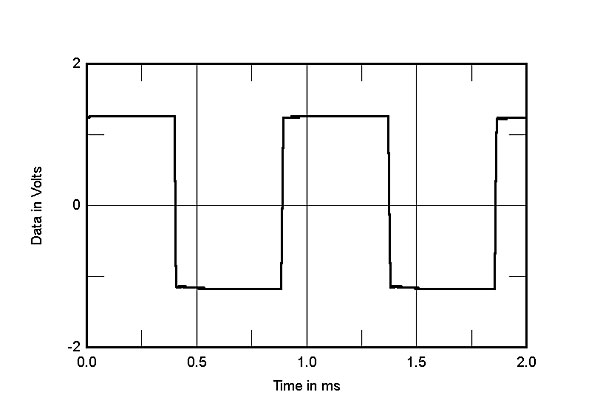
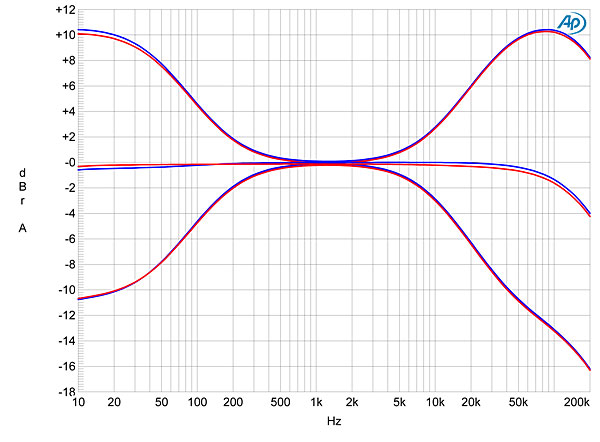


Fig.1 Cambridge Azur 851A, volume control set to maximum, Direct mode, frequency response at 2.83V into: simulated loudspeaker load (gray), 8 ohms (left channel blue, right red), 4 ohms (left cyan, right magenta), 2 ohms (green) (0.5dB/vertical div.).
Fig.2 Cambridge Azur 851A, small-signal, 10kHz squarewave into 8 ohms.
Fig.3 Cambridge Azur 851A, small-signal, 1kHz squarewave into 8 ohms.
Activating the Treble and Bass tone controls (I successfully unstuck the Treble control knob with a toothpick) and setting them to their maximum and minimum positions gave the traces shown in fig.4. These controls are shelving types that produce up to ±10dB measured change in response below 30Hz and above 40kHz. The change in response at 80Hz and 10kHz was a more modest and appropriate ±6dB. Channel separation (not shown) was 78dB in both directions below 5kHz. The wideband, unweighted signal/noise ratio (ref. 2.83V into 8 ohms with the volume set to its maximum) was modest at 57.8dB, but improved to 74.8dB when the measurement bandwidth was reduced to the audioband, and 77.2dB when A-weighted. Spectral analysis of the amplifier's output while it drove a 1kHz tone at 1W into 8 ohms (fig.5) indicated that the supply-related component at 120Hz was the highest-level noise component, at –86dB, though other supply-related components are also present. Experimenting with the grounding between the analyzer and the amplifier didn't change this behavior.
Fig.4 Cambridge Azur 851A, response with Bass and Treble controls set to "0," maximum, minimum (left channel blue, right red; 2dB/vertical div.).
Fig.5 Cambridge Azur 851A, spectrum of 1kHz sinewave, DC–1kHz, at 1W into 8 ohms (linear frequency scale).
Fig.6 plots the left channel's percentage of THD+noise against output power into 8 ohms. The downward slope of the trace below 100W reveals that the measurement is dominated by noise, actual distortion components not rising above the noise floor until the amplifier is close to clipping. However, it wasn't possible to measure the Cambridge's power at our usual definition of clipping, 1% THD+N, because at 136.4Wpc into 8 ohms (21.35dBW, 0.55dB above the specified maximum power of 120W), the 851A's protection circuit operated the volume control to reduce the level, as indicated by the downward step in this graph above 136.4Wpc. The same thing happened with both channels driven into 4 ohms (fig.7), with the volume control now being taken over above 220.5Wpc (20.4dBW).
Fig.6 Cambridge Azur 851A, left channel, distortion (%) vs 1kHz continuous output power into 8 ohms.
Fig.7 Cambridge Azur 851A, left channel, distortion (%) vs 1kHz continuous output power into 4 ohms.
Looking at the distortion waveform in the left channel at a reasonably high power, 40W into 4 ohms, there is just a hint of second harmonic visible (fig.8, bottom trace), even though, to lower the contribution of noise in this graph, I averaged 64 captures. However, when I plotted the THD+N percentage against frequency at 20V into 8 and 4 ohms (fig.9), respectively equivalent to 50 and 100Wpc, while both channels offered the expected low distortion into 8 ohms (blue and red traces), the right channel offered higher distortion into 4 ohms (magenta). I repeated the clipping test into 8 ohms with the right channel; when this result (fig.10) is compared with fig.5, it can be seen that the distortion in the right channel begins to rise above the noise floor above a few tens of watts, though it remains below 0.04% below 100W.
Fig.8 Cambridge Azur 851A, left channel, 1kHz waveform at 40W into 4 ohms, 0.007% THD+N (top); distortion and noise waveform with fundamental notched out (bottom, not to scale).
Fig.9 Cambridge Azur 851A, THD+N (%) vs frequency at 20V into: 8 ohms (left channel blue, right red), 4 ohms (left cyan, right magenta).
Fig.10 Cambridge Azur 851A, right channel, distortion (%) vs 1kHz continuous output power into 8 ohms.
Fig.11, taken at a relatively high power into 4 ohms, reveals that the right channel (red trace) has a much higher proportion of both odd- and even-order distortion products than does the left (blue), with the third harmonic the highest in level at –69dB (0.03%). I don't believe this will give rise to audible problems, but this behavior does suggest that Cambridge's "Class XD (crossover displacement)" circuit was not working correctly in the 851A's right channel. Even so, when I tested for intermodulation distortion at a very high power into 4 ohms, I found no distortion products higher than –80dB (0.01%) (fig.12).
Fig.11 Cambridge Azur 851A, spectrum of 50Hz sinewave, DC–1kHz, at 80W into 4 ohms (linear frequency scale).
Fig.12 Cambridge Azur 851A, HF intermodulation spectrum, DC–30kHz, 19+20kHz at 150W peak into 4 ohms (linear frequency scale).
Assuming that the less-good performance of its right channel was a sample-specific fault, Cambridge Audio's Azur 851A is a well-built amplifier that offers a lot of power with very low distortion at an affordable price.—John Atkinson