Sidebar 3: Measurements
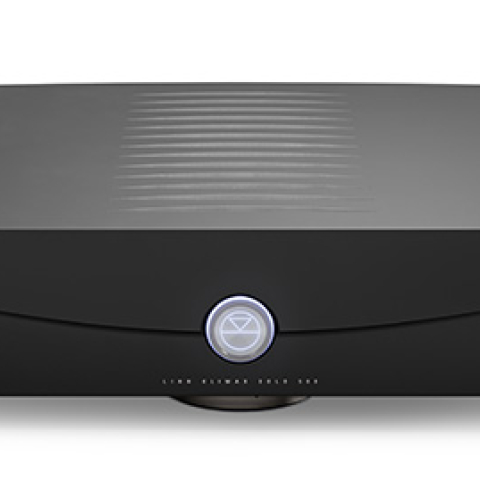
The VAC Sigma 170i iQ uses two pairs of Gold Lion KT88 tubes for its output stages and eight small-signal tubes. The tubes are identified with a number, this between the pins of the small-signal tubes. The tube locations are clearly indicated in the manual and the top panel has each tube socket marked with the appropriate tube number. I carefully followed the numbering when installing the tubes before connecting the amplifier first to my Audio Precision SYS2722 (see the January 2008 "As We See It"), then to the magazine's higher-performance APx555 analyzer in order to repeat some of the tests. The condition-monitoring LEDs for the four KT88s remained dark throughout the testing, indicating that these tubes were operating correctly. The output transformer taps are marked "8–16," "4–8," and "2–4." I performed a complete series of tests from each of the three taps using the single-ended line-level inputs then repeated some of the tests using the balanced inputs.
The Sigma 170i iQ's unbalanced input impedance was a high 44.7k ohms at 20Hz, dropping to a still-high 33k ohms at 1kHz and 20kHz. The balanced input impedance was slightly greater than twice the unbalanced impedance across the audioband. The 170i iQ inverted absolute polarity with both sets of inputs from all three transformer taps and from the preamplifier outputs. The amplifier's maximum voltage gain at 1kHz into 8 ohms depended on the output tap. The highest gain was from the 8–16 ohm tap, at 48.1dB for both balanced and unbalanced inputs. The gain from the 4–8 ohm tap was 47.8dB, and from the 2–4 ohm tap it was 46.4dB. These gains are somewhat higher than usually found in integrated amplifiers. The gain at the preamplifier output was 21.6dB, sourced from a low output impedance of 340 ohms at high and middle frequencies but from a high 3154 ohms in the low bass.
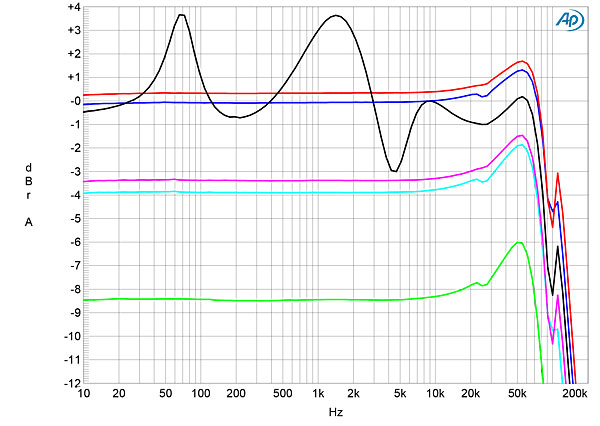
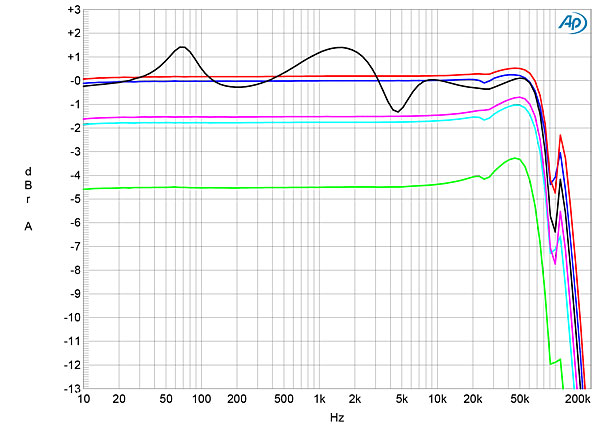
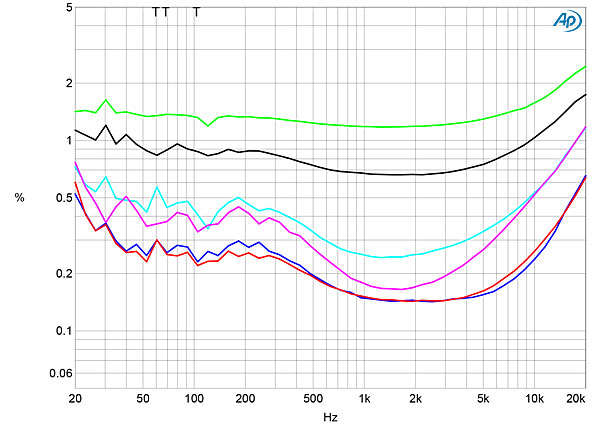
The amplifier's output impedance depended on the output tap. From the 8–16 ohm tap, the impedance was an extremely high 8.8 ohms at 20Hz and 1kHz, dropping very slightly to 8 ohms at 20kHz. The VAC amplifier appears to adhere to telecommunications practice, where the output impedance is similar in value to the load impedance. This results in maximum power transfer to the load, but as can be seen from the gray trace in fig.1, it also results in large and very audible ±3.5dB variations in frequency response with our standard simulated loudspeaker. The variations in response were reduced to ±2.1dB with the 4–8 ohm tap—which had an output impedance of 4.4 ohms at 20Hz and 1kHz, 4 ohms at 20kHz—and to ±1.2dB from the 2–4 ohm tap (fig.2). This tap had an output impedance of 2.2 ohms at 20Hz and 1kHz, 1.95 ohms at 20kHz.
 Turning to the optional phono input, I got the lowest noise by floating the signal generator ground and connecting the Sigma 170i iQ's chassis-grounding terminal to the analyzer ground. I primarily tested the VAC's phono input from the preamplifier output.
The VAC's phono stage inverted absolute polarity at all outputs in moving magnet and moving coil modes. The MM input impedance was 53k ohms at 20Hz and 1kHz, and 46.5k ohms at 20kHz. In MC mode, with the input impedance set to 470 ohms, I measured 71 ohms at 20Hz, 430 ohms at 1kHz, and 324 ohms at 20kHz. With the input impedance set to 200 ohms, I measured 70 ohms at 20Hz, 183 ohms at 1kHz, and 168 ohms at 20kHz. With the input impedance set to 100 ohms, I measured 60 ohms at 20Hz, 89 ohms at 1kHz, and the same at 20kHz. With the volume control set to its maximum, MM mode offered 56.9dB of gain at the preamplifier output and 81.8dB at the 8–16 ohm loudspeaker output. In MC mode, the maximum gain was 77dB at the preamplifier output and 101.4dB at the 8–16 ohm loudspeaker output. Taking the 21.6dB gain in the preamplifier section into account, these measurements are consistent with the stated phono-section gains of 37dB (MM) and 57dB (MC).
The Sigma 170i iQ's RIAA correction offered very low error (fig.14), with a slight (0.25dB) boost in the bass before the sharp rolloff that indicates the presence of a subsonic high-pass filter. The RIAA correction was well-matched between the channels. However, there is a slight peak apparent between 50kHz and 100kHz. (This peak was also present when I measured the balanced line input's response from the preamplifier outputs.)
Turning to the optional phono input, I got the lowest noise by floating the signal generator ground and connecting the Sigma 170i iQ's chassis-grounding terminal to the analyzer ground. I primarily tested the VAC's phono input from the preamplifier output.
The VAC's phono stage inverted absolute polarity at all outputs in moving magnet and moving coil modes. The MM input impedance was 53k ohms at 20Hz and 1kHz, and 46.5k ohms at 20kHz. In MC mode, with the input impedance set to 470 ohms, I measured 71 ohms at 20Hz, 430 ohms at 1kHz, and 324 ohms at 20kHz. With the input impedance set to 200 ohms, I measured 70 ohms at 20Hz, 183 ohms at 1kHz, and 168 ohms at 20kHz. With the input impedance set to 100 ohms, I measured 60 ohms at 20Hz, 89 ohms at 1kHz, and the same at 20kHz. With the volume control set to its maximum, MM mode offered 56.9dB of gain at the preamplifier output and 81.8dB at the 8–16 ohm loudspeaker output. In MC mode, the maximum gain was 77dB at the preamplifier output and 101.4dB at the 8–16 ohm loudspeaker output. Taking the 21.6dB gain in the preamplifier section into account, these measurements are consistent with the stated phono-section gains of 37dB (MM) and 57dB (MC).
The Sigma 170i iQ's RIAA correction offered very low error (fig.14), with a slight (0.25dB) boost in the bass before the sharp rolloff that indicates the presence of a subsonic high-pass filter. The RIAA correction was well-matched between the channels. However, there is a slight peak apparent between 50kHz and 100kHz. (This peak was also present when I measured the balanced line input's response from the preamplifier outputs.)
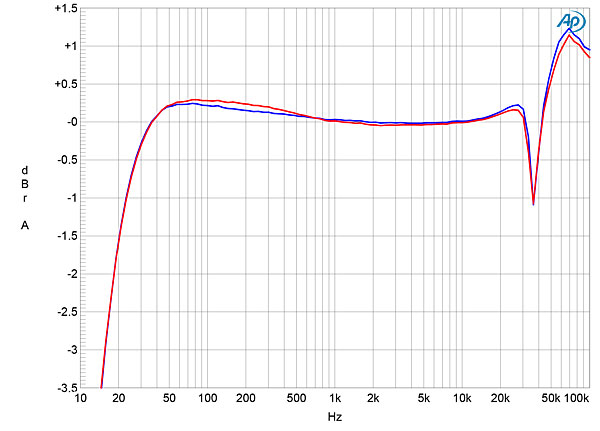
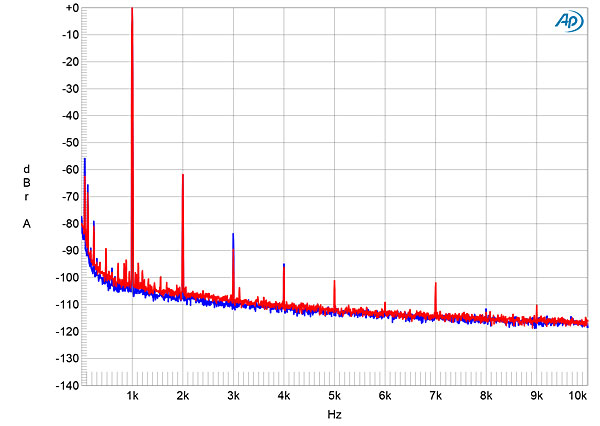
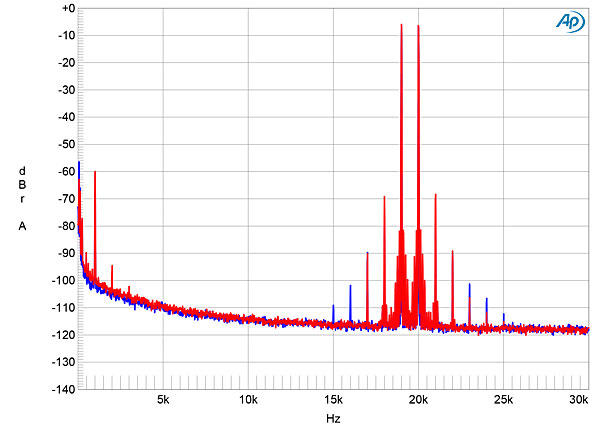
Fig.1 VAC Sigma 170i IQ, 8–16 ohm tap, frequency response at 2.83V into: simulated loudspeaker load (gray), 8 ohms (left channel blue, right red), 4 ohms (left cyan, right magenta), 2 ohms (green) (2dB/vertical div.).
Fig.2 VAC Sigma 170i IQ, 2–4 ohm tap, frequency response at 2.83V into: simulated loudspeaker load (gray), 8 ohms (left channel blue, right red), 4 ohms (left cyan, right magenta), 2 ohms (green) (3dB/vertical div.).
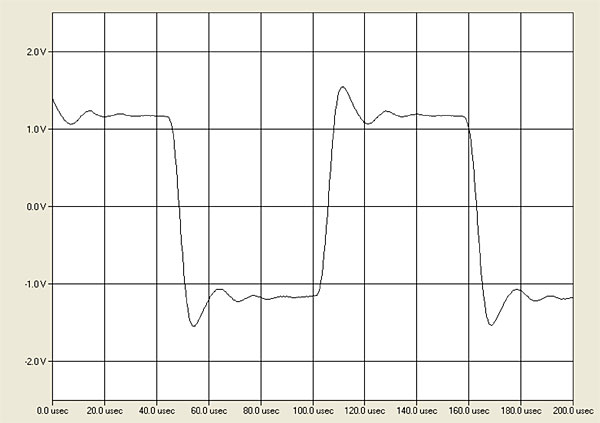
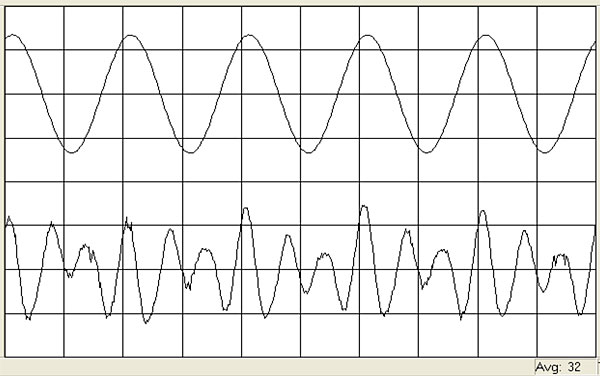
The small-signal bandwidth is wide and flat to 20kHz into resistive loads from all three transformer taps (blue, red, cyan, magenta, and green traces in figs.1 and 2), though two ultrasonic resonances can be seen. These were highest in level when the load impedance was lower than the nominal tap value. This behavior is associated with a small amount of overshoot and ringing with the amplifier's reproduction of a 10kHz squarewave (fig.3). At lower frequencies, the amplifier's reproduction of squarewaves had flat tops and bottoms, confirming the Sigma 170i iQ's extended low frequencies.
Fig.3 VAC Sigma 170i IQ, 8–16 ohm tap, small-signal 10kHz squarewave into 8 ohms.
Figs.1 and 2 were taken with the volume control set to its maximum. The channel matching was within 0.2dB and didn't change at lower settings of the volume control. Channel separation was not as good as I expected, at 60dB, L–R, and 68dB, R–L, below 2kHz, and the figures reduced to 35dB and 49dB, respectively, at the top of the audioband.
Measured at the 8–16 ohm taps and taken with the inputs shorted to ground, the amplifier's unweighted, wideband signal/noise ratio was 49.9dB (average of both channels) ref. 1W into 8 ohms. This ratio improved to 69.2dB, when the measurement bandwidth was restricted to the audioband, and to 76.3dB when A-weighted. The S/N ratios from the 4–8 ohm tap were slightly greater and up to 2dB greater from the 2–4 ohm tap, correlating with the lower gain.
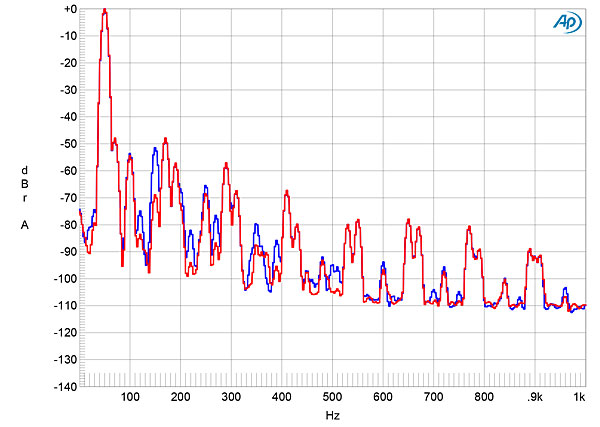
With the volume control set to its minimum, the main power supply–related spuriae in the Sigma 170i iQ's noise floor were at 60Hz, 120Hz, and 180Hz (fig.4, green and gray traces), with the highest in level (at 120Hz) lying at –72dB ref. 1W from the 8–16 ohm tap into 8 ohms. Peculiarly, with the volume control set to its maximum and the amplifier driving 1kHz at 1W into 8 ohms, sidebands appeared at ±120Hz, ±240Hz, and ±360Hz either side of the peak at 1kHz in this spectrum. I repeated this spectral analysis at lower settings of the volume control and with several different grounding arrangements: floating the amplifier's AC ground; floating the SYS2722's signal generator ground and connecting the analyzer's chassis and the VAC's chassis with a separate wire; and repeating these conditions with the APx555 system. There was no change in this behavior; it is probably due to a nonzero impedance connection from signal ground to power-supply ground somewhere in the Sigma 170i iQ's circuit.
Fig.4 VAC Sigma 170i IQ, 8–16 ohm tap, spectrum of 1kHz sinewave, DC–1kHz, at 1W into 8 ohms with volume control at its maximum (left channel blue, right red) and at its minimum (left green, right gray) linear frequency scale).
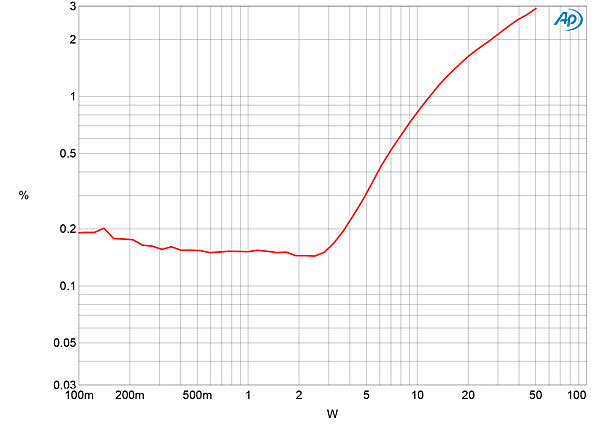
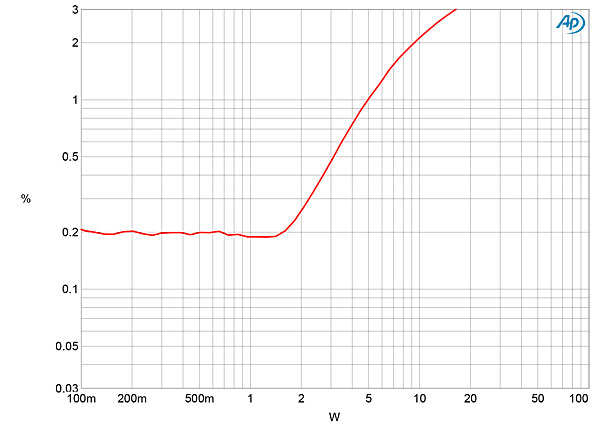
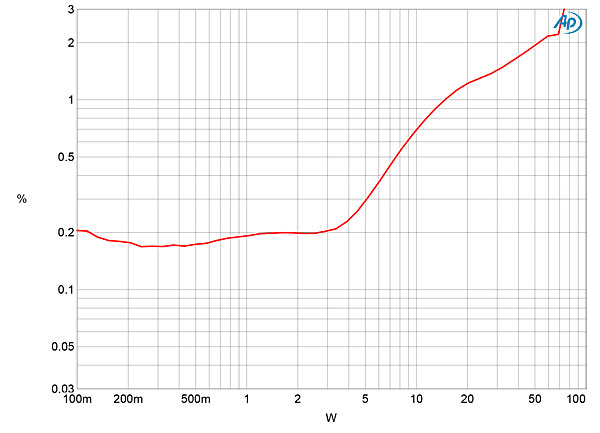
The VAC amplifier is specified as delivering 85Wpc, presumably into 8 ohms (19.3dBW), which is a little higher than I would expect from a push-pull pair of KT88s. Using our definition of clipping, which is when the output's THD+noise percentage reaches 1%, the amplifier with both channels driven with a 1kHz signal clipped at 11.8Wpc into 8 ohms (10.7dBW) from the 8–16 ohm output transformer tap (fig.5). Relaxing the definition of clipping to 3% THD+N resulted in a power of 51Wpc into 8 ohms (17.1dBW). The shape of the trace in fig.5 suggests that the amplifier is "soft" clipping, with the usual sharp "knee" in the trace where the waveform squares off occurring at THD+N levels above 3%. Less power was available into 4 ohms from the 8–16 ohm tap, 3% THD+N being reached at 10.75W (7.3dBW. fig.6).
Fig.5 VAC Sigma 170i IQ, 8–16 ohm tap, distortion (%) vs 1kHz continuous output power into 8 ohms.
Fig.6 VAC Sigma 170i IQ, 8–16 ohm tap, distortion (%) vs 1kHz continuous output power into 4 ohms.
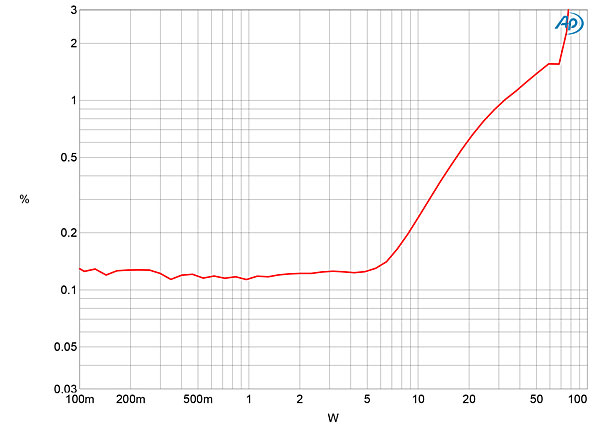
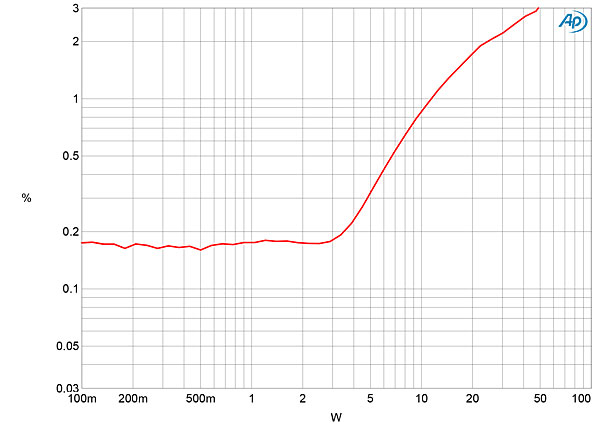
From the 4–8 ohm tap, the Sigma 170i iQ reached 1% THD+N at 32.6Wpc into 8 ohms (15.1dBW) and 79Wpc (19.0dBW) at 3% THD+N (fig.7). Less power was available into 4 ohms from this tap: 49Wpc at 3% THD+N (13.9dBW, fig.8). The 2–4 ohm tap was probably optimal for real loudspeaker loads, reaching 3% THD+N at 53Wpc into 8 ohms (17.24dBW), 75Wpc into 4 ohms (15.74dBW), and 74Wpc into 2 ohms (12.67dBW, fig.9).
Fig.7 VAC Sigma 170i IQ, 4–8 ohm tap, distortion (%) vs 1kHz continuous output power into 8 ohms.
Fig.8 VAC Sigma 170i IQ, 4–8 ohm tap, distortion (%) vs 1kHz continuous output power into 4 ohms.
Fig.9 VAC Sigma 170i IQ, 2–4 ohm tap, distortion (%) vs 1kHz continuous output power into 2 ohms.
The distortion levels in figs.5–8 never drop below 0.1% (–60dB); this will be due in part to the presence of the power-supply noise noted earlier. The lowest distortion I found was with the 2–4 ohm tap driving a load of 8 ohms. This can be seen in fig.10, which plots the THD+N percentage against frequency at 6.35V, which is equivalent to 5W into 8 ohms, 10W into 4 ohms, and 20W into 2 ohms. The THD+N was lowest in the low treble into 8 ohms (blue and red traces) but rose at higher and lower frequencies and into lower impedances. The left channel (cyan and green traces) had higher distortion into 4 and 2 ohms than the right (magenta and gray traces).
Fig.10 VAC Sigma 170i IQ, 2–4 ohm tap, THD+N (%) vs frequency at 6.35V into: 8 ohms (left blue, right red), 4 ohms (left cyan, right magenta), 2 ohms (left green, right gray).
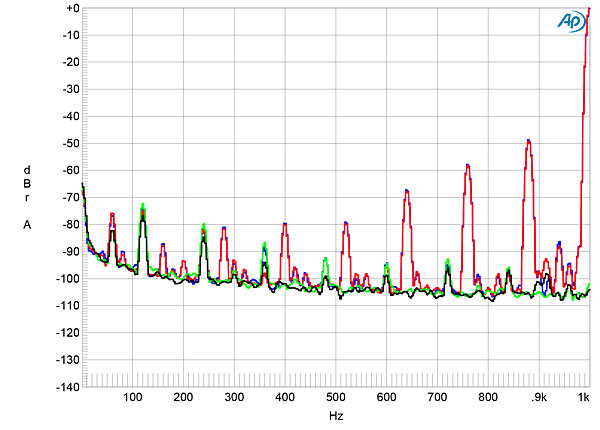
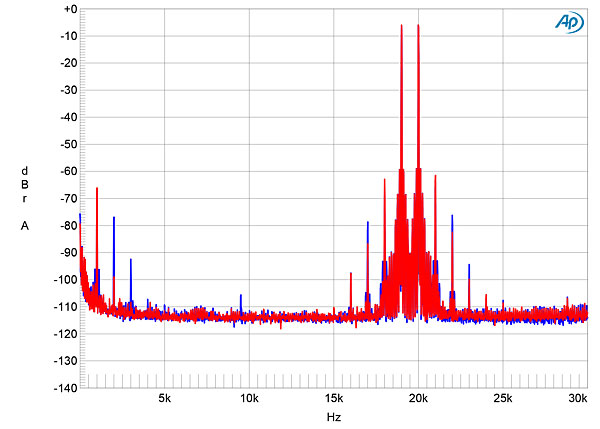
The Sigma 170i iQ's distortion in the left channel was predominantly the third harmonic (fig.11). However, the second harmonic was the highest in the right channel (fig.12, red trace), though the distortion harmonics in this graph are below the level of the supply-related spuriae. When the amplifier drove an equal mix of 19 and 20kHz tones at a peak level of 8W into 8 ohms from the 2–4 ohm tap (fig.13), the second-order difference product at 1kHz lay at –66dB (0.05%), though the higher-order intermodulation products were a little higher in level. Repeating this spectral analysis from the 8–16 ohm tap, the 1kHz product rose to –60dB (0.1%, not shown).
Fig.11 VAC Sigma 170i IQ, 8–16 ohm tap, 1kHz waveform at 5W into 8 ohms, 0.35% THD+N (top); distortion and noise waveform with fundamental notched out (bottom, not to scale).
Fig.12 VAC Sigma 170i IQ, 8–16 ohm tap, spectrum of 50Hz sinewave, DC–1kHz, at 5Wpc into 8 ohms (left channel blue, right red; linear frequency scale).
Fig.13 VAC Sigma 170i IQ, 8–16 ohm tap, HF intermodulation spectrum, DC–30kHz, 19+20kHz at 8Wpc peak into 8 ohms (left channel blue, right red; linear frequency scale).
Fig.14 VAC Sigma 170i IQ, phono input, MM mode, response with RIAA correction (left channel blue, right red, 0.5dB/vertical div.)
With the volume control set to its maximum, the phono input's noise performance in MM mode was good, with unweighted audioband signal/noise ratios (ref. 1kHz at 5mV input signal) of 49.9dB, left channel, and 55dB, right. These ratios improved by 20dB when A-weighted. The higher gain in the MC mode reduced the S/N ratios, this time ref. 1kHz at 500µV, by around 5dB.
The Sigma 170i iQ phono input offered excellent overload margins at 27dB at 1kHz and 20kHz ref. 1kHz at 5mV in MM mode. In MC mode, the overload margin was 26dB at both frequencies ref. 1kHz at 500ÊV. However, the margins were very much lower at 20Hz, at around 3dB in both MM and MC modes. Low-output phono cartridges will work better with the VAC's phono stage. The phono input's distortion was low, primarily consisting of the second harmonic. At an input level 6dB higher than the nominal MM output level of 5mV, this lay at –60dB (0.1%, fig.15). Intermodulation distortion via the VAC's phono input was similarly low (fig.16).
Fig.15 VAC Sigma 170i IQ, phono input, MM mode, spectrum of 1kHz sinewave, DC–10kHz, at 10mV input (left channel blue, right red; linear frequency scale).
Fig.16 VAC Sigma 170i IQ, phono input, MM mode, HF intermodulation spectrum, DC–30kHz, 19+20kHz at 100mV peak input (left channel blue, right red; linear frequency scale).
Especially in terms of its output impedance, the VAC 170i iQ resembles other "classic" tube-amp designs such as the (now discontinued) PrimaLuna Prologue Premium. A common argument in favor of such designs is that they don't employ feedback to reduce their output impedance, which can have negative sonic consequences. But there are also sonic consequences to such high output impedances. As illustrated in figs.1 and 2, when used from the 4–8 ohm and 8–16 ohm transformer taps, this amplifier will change sonic character with every loudspeaker it is used with.—John Atkinson