Sidebar 3: Measurements
I performed a full set of measurements on the McIntosh DS200 using my Audio Precision SYS2722 system then repeated some of the tests with the magazine's higher-resolution APx555 analyzer. The coaxial S/PDIF, optical TosLink, and AES3 inputs all accepted data sampled at rates up to 192kHz. Apple's AudioMIDI utility revealed that the USB port accepted 16- and 24-bit integer data sampled at all rates from 44.1kHz to 768kHz. The USB Prober app identified the DS200 as "MSA5500" from "McIntosh" and indicated that the USB port operated in the optimal isochronous asynchronous mode. When I connected the McIntosh's Ethernet port to my network, Roon recognized the processor as the Roon Ready "McIntosh DS200." After a factory reset, I used optical S/PDIF data for the testing as well as USB data sourced from my MacBook Pro and network data played with Roon.
The DS200's nominal maximum output level can be set to "2V," "5V," "6V," and "8V." With the Trim control set to "0dB," the balanced output levels with a 1kHz signal at 0dBFS were 3.9V, 9.8V, 11.6V, and 16V, respectively, though the waveform was clipped at the highest setting. As expected, the single-ended output levels were half the balanced levels. As the manual recommends the "2V" setting for use with a preamplifier, that is what I used for the tests, leaving the DS200 in Fixed mode. I primarily examined the balanced outputs. The balanced source impedance was 200 ohms at 20kHz and 1kHz rising to 1130 ohms at 20Hz. The single-ended source impedance was 486 ohms at the bottom of the audioband, dropping to 100 ohms in the midrange and high treble. The DS200 preserved absolute polarity, ie, was noninverting, for both output types.
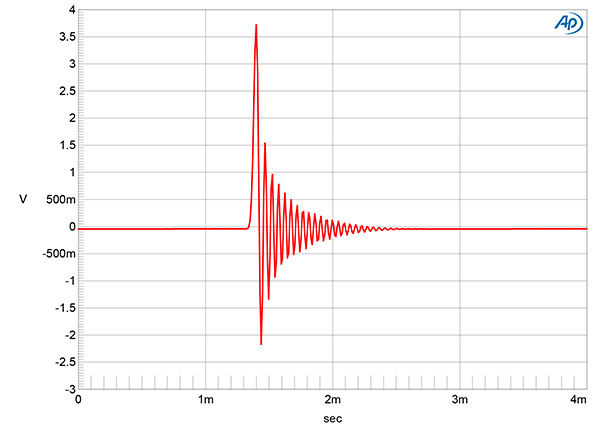
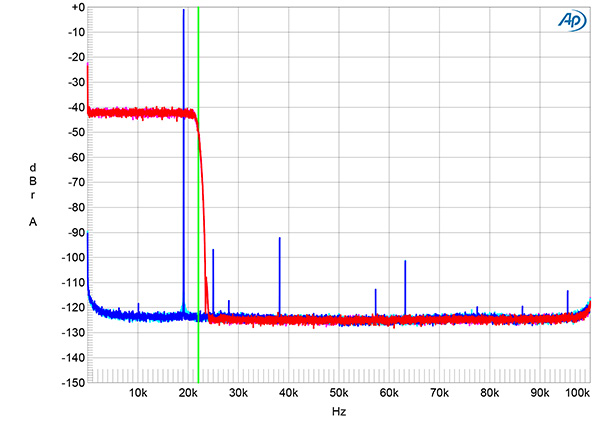
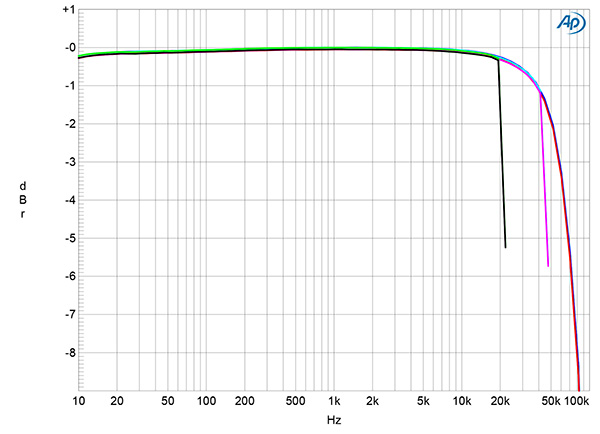
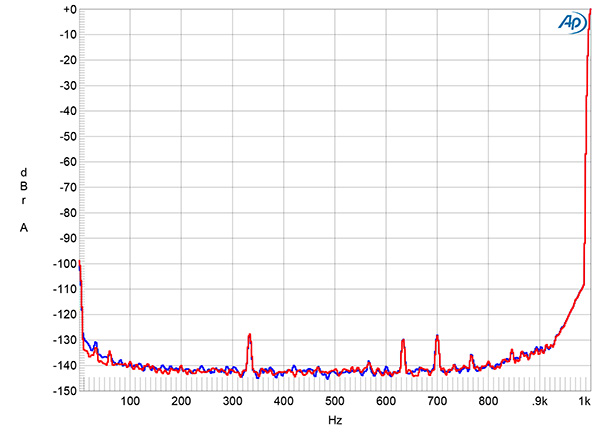
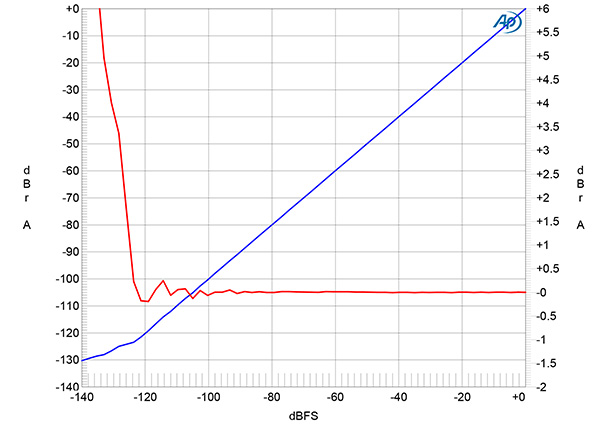
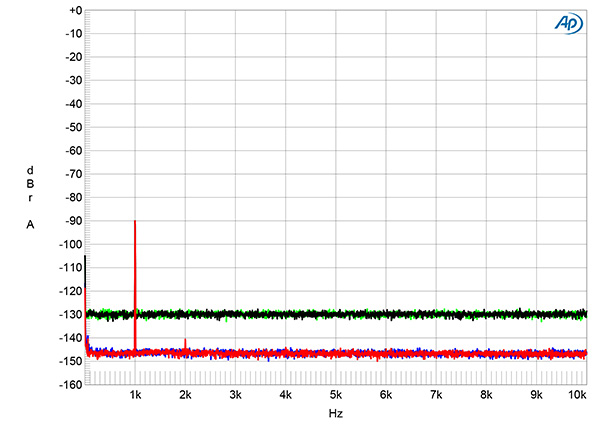
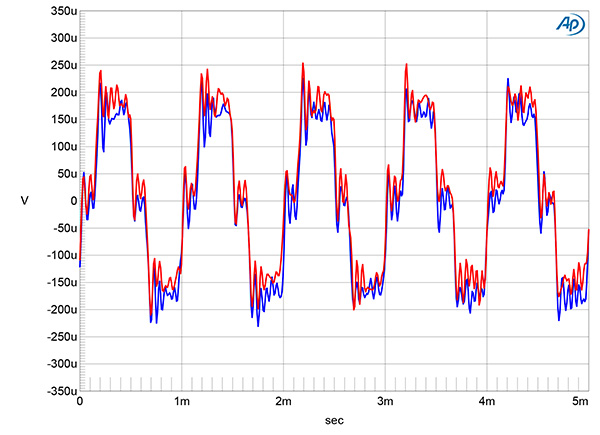
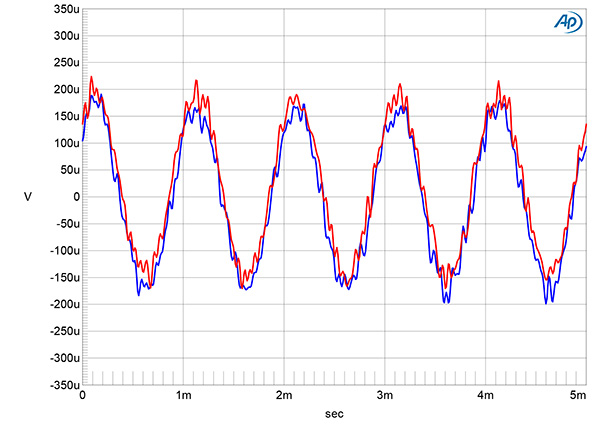
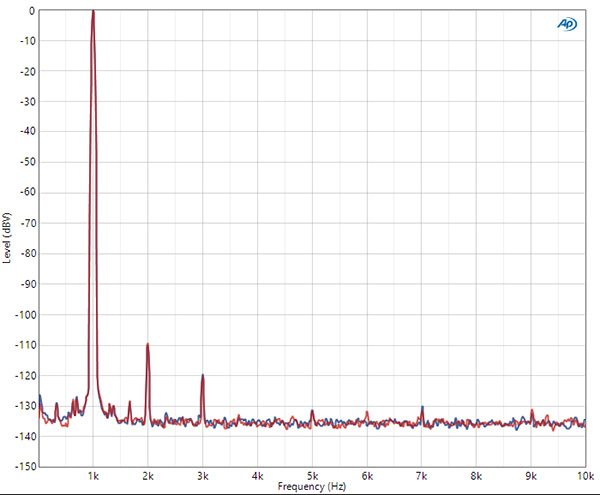
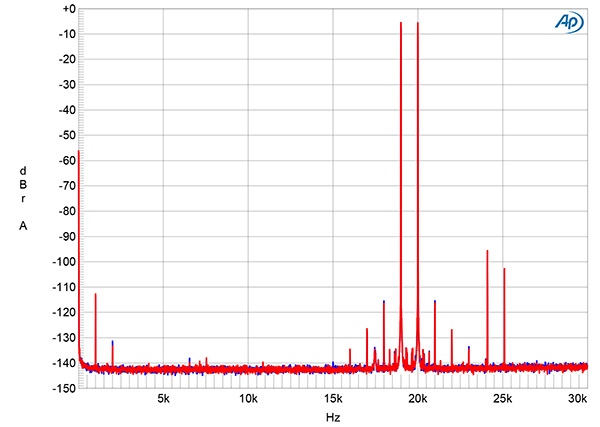
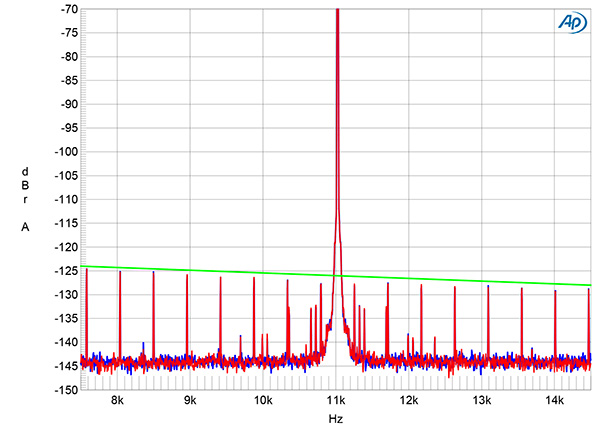
Fig.1 McIntosh DS200, impulse response with one sample at 0dBFS, 44.1kHz data, 4ms time window).
Fig.2 McIntosh DS200, wideband spectrum of white noise at –4dBFS (left channel red, right magenta) and 19.1kHz tone at 0dBFS (left blue, right cyan) into 100k ohms with data sampled at 44.1kHz (20dB/vertical div.).
The McIntosh's impulse response is shown in fig.1. It is typical of a long minimum-phase filter, with all the ringing following the single sample at 0dBFS. The magenta and red traces in fig.2 show the McIntosh's wideband spectrum with 44.1kHz white noise data at –4dBFS. The response rolls off sharply above the audioband, with full stopband attenuation reached at 24kHz. The image at 25kHz of a full-scale 19.1kHz tone (cyan, blue traces) is suppressed by 97dB, and while the second and third harmonics of the 19.1kHz tone are visible, they are very low in level.
Fig.3 McIntosh DS200, frequency response at –12dBFS into 100k ohms with data sampled at: 44.1kHz (left channel green, right gray), 96kHz (left cyan, right magenta), and 192kHz (left blue, right red) (1dB/vertical div.).
Fig.4 McIntosh DS200, level set to "2V," balanced, spectrum of 1kHz sinewave, DC–1kHz, at 0dBFS (left channel blue, right red, linear frequency scale).
The McIntosh DS200's frequency response with 44.1kHz, 96kHz, and 192kHz data (fig.3) was flat in the audioband and followed the same basic shape at all three sample rates, with a very sharp rolloff just below half of each rate. Channel separation was excellent above 1kHz, at >80dB in both directions. However, the separation decreased at lower frequencies and was just 44dB at 100Hz and 29dB at 20Hz. This behavior was identical with both output types and at all level settings. The low-frequency balanced noisefloor with the level set to "2V" (fig.4) was very low in level and was free from power supply–related spuriae. However, low-level tones of unknown origin were present at 332Hz, 633Hz, and 700Hz. When the volume control is used, the level of the noisefloor is reduced in proportion to the amount of attenuation. For example, with the volume control set to –12dB, the level of the random noisefloor in fig.4 dropped by 12dB.
Fig.5 McIntosh DS200, left channel, 1kHz output level vs 24-bit data level in dBFS (blue, 10dB/vertical div.); linearity error (red, 1dB/small vertical div.).
Fig.6 McIntosh DS200, spectrum with noise and spuriae of dithered 1kHz tone at –90dBFS with 16-bit data (left channel green, right gray) and 24-bit data (left blue, right red) (20dB/vertical div.).
Fig.7 McIntosh DS200, waveform of undithered 16-bit, 1kHz sinewave at –90.31dBFS (left channel blue, right red).
Fig.8 McIntosh DS200, waveform of undithered 24-bit, 1kHz sinewave at –90.31dBFS (left channel blue, right red).
The red trace in fig.5 plots the error in the balanced output level as a 24-bit, 1kHz digital tone steps down from 0dBFS to –140dBFS. The amplitude error is low down to –120dBFS, which suggests the DS200's DAC features reasonably high resolution. Fig.6 shows the DS200's balanced output spectra with 16- and 24-bit dithered data representing a 1kHz tone at –90dBFS. The increase in bit depth lowered the noisefloor by 18dB, which suggests a measured resolution of 19 bits. With undithered data representing a tone at exactly –90.31dBFS, which consists of data at –1LSB, digital zero, and +1LSB, the waveform was symmetrical, and the three DC voltage levels described by the data were readily resolved (fig.7). With undithered 24-bit data at –90.31dBFS, the McIntosh output a relatively clean sinewave (fig.8).
Fig.9 McIntosh DS200, spectrum of 1kHz sinewave, 24-bit data, at 0dBFS, DC–1kHz, into 200k ohms (left channel blue, right red; linear frequency scale).
Fig.10 McIntosh DS200, HF intermodulation spectrum (DC–30kHz), 19+20kHz, 24-bit data, at 0dBFS into 600 ohms (left channel blue, right red; linear frequency scale).
The McIntosh DS200's distortion signature in the midrange primarily comprised the second and third harmonics (fig.9); these were very low in level, lying, respectively, at –110dB (0.0003%) and –120dB (0.0001%). These were joined by higher-order harmonics with low-frequency signals at still lower levels (not shown). Intermodulation distortion with 24-bit data representing an equal mix of 19 and 20kHz tones, each at –6dBFS, was also extremely low in level, even into 600 ohms (fig.10). The difference product at 1kHz lay at –114dB (0.0002%).
Fig.11 McIntosh DS200, 16-bit optical data, high-resolution jitter spectrum of analog output signal, 11.025kHz at –6dBFS, sampled at 44.1kHz with LSB toggled at 229Hz (left channel blue, right red). Center frequency of trace, 11.025kHz; frequency range, ±3.5kHz.
The McIntosh DS200 offered respectable jitter rejection with all its inputs. Fig.11 shows the spectrum of the DS200's output when it was fed 16-bit optical J-Test data. The odd-order harmonics of the undithered low-frequency, LSB-level squarewave all lie at the correct levels, and the noisefloor between those harmonics is appropriately low in level. However, the spectral spike that represents the high-level tone at one-quarter the sample rate is broadened at its base due to low-level, low-frequency random jitter. Some low-level sidebands are present at frequencies that are not signal-related.
In many respects—the high resolution, the rejection of data-related jitter, the very low levels of distortion and noise—the McIntosh DS200 offered excellent measured performance. I was bothered by the poor channel separation at low frequencies, however.—John Atkinson