
Sidebar 3: Measurements
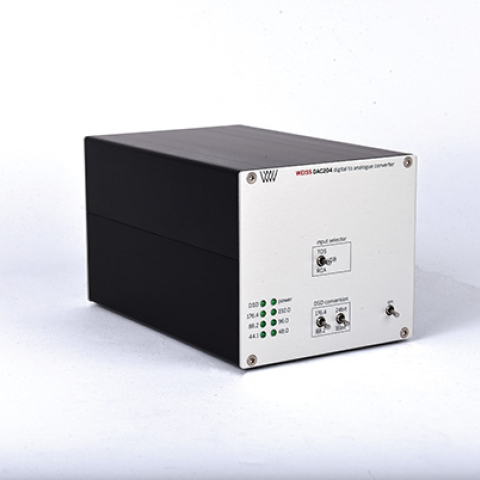
I performed a full set of measurements on the Weiss DAC204 using my Audio Precision SYS2722, repeating some of the testing with the magazine's higher-resolution APx555 analyzer. I used optical and coaxial S/PDIF data—the TosLink input accepted data sampled at rates up to 96kHz—as well as USB data sourced from my MacBook Pro. Apple's USB Prober utility identified the processor as "xCORE USB Audio 2.0" from "XMOS" and indicated that the USB port operated in the optimal isochronous asynchronous mode. The AudioMIDI utility revealed that the 204's USB port accepted 16- and 24-bit integer data sampled at all rates from 44.1kHz to 384kHz.
The Weiss 204's output levels with a full-scale 1kHz signal were 6.84V, balanced, and 3.42V, unbalanced. Two switches on the rear panel allow the level to be attenuated by up to 30dB in 10dB steps. The measured adjustments in level were exactly –10dB, –20dB, and –30dB. Except where noted, I performed all the measurements without any attenuation. The Weiss preserved absolute polarity from the balanced and unbalanced line outputs. The output impedances were usefully low from the balanced and the single-ended outputs at 94 ohms and 47 ohms, respectively, both consistent from 20Hz to 20kHz.


Footnote 1: I asked Daniel Weiss how the S/N ratio varies with the attenuation setting. His answer: For a full-scale (0dBFS) input, the S/N ratio varies from 112dB with no attenuation to 108dB with attenuation of 30dB. For a –40dBFS input, the S/N ratio varies from 123dB to 109dB under the same conditions.—Jim Austin
Fig.1 Weiss 204, impulse response (one sample at 0dBFS, 44.1kHz data, 4ms time window).
Fig.2 Weiss 204, wideband spectrum of white noise at –4dBFS (left channel red, right magenta) and 19.1kHz tone at 0dBFS (left blue, right cyan) into 100k ohms with data sampled at 44.1kHz (20dB/vertical div.).
Fig.1 shows the Weiss 204's impulse response with data sampled at 44.1kHz. It is typical of a long linear-phase filter with symmetrical ringing before and after the single full-scale sample. The magenta and red traces in fig.2 show the Weiss's wideband spectrum with 44.1kHz white noise data at –4dBFS. The response rolls off sharply above the audioband, with full stopband attenuation reached at 24kHz. Consequently, the image at 25kHz of a full-scale 19.1kHz tone (cyan, blue traces) is completely suppressed.
Fig.3 Weiss 204, frequency response at –12dBFS into 100k ohms with data sampled at: 44.1kHz (left channel green, right gray), 96kHz (left cyan, right magenta), and 192kHz (left blue, right red) (1dB/vertical div.).
Fig.4 Weiss 204, spectrum of 24-bit 1kHz tone at 0dBFS, DC–1kHz (left channel blue, right red; 20dB/vertical div.).
The Weiss 204's frequency response with 44.1kHz, 96kHz, and 192kHz data (fig.3) is flat in the audioband and follows the same basic shape, with a sharp rolloff just below half of each sample rate. The frequency response was identical from both output types and was not affected by the attenuation settings. Channel separation was superb, at >120dB in both directions below 3kHz and still 113dB at the top of the audioband. The low-frequency noisefloor was very low in level and free from power supply–related spuriae (fig.4). The noisefloor level rose by up to 10dB—no more—with attenuation activated (footnote 1).
Fig.5 Weiss 204, left channel, 1kHz output level vs 24-bit data level in dBFS (blue, 20dB/vertical div.); linearity error (red, 1dB/small vertical div.).
Fig.6 Weiss 204, spectrum with noise and spuriae of dithered 1kHz tone at –90dBFS with 16-bit data (left channel green, right gray) and 24-bit data (left blue, right red) (20dB/vertical div.).
The red trace in fig.5 plots the error in the analog output level as a 24-bit, 1kHz digital tone is stepped down from 0dBFS to –140dBFS. The amplitude error is negligible down to –136dBFS, which implies superbly high resolution. When I examined the spectra with 16- and 24-bit dithered data representing a 1kHz tone at –90dBFS, the increase in bit depth lowered the noisefloor by 32dB (fig.6). This suggests a measured resolution of 21 bits, which is state of the art.
Fig.7 Weiss 204, waveform of undithered 1kHz sinewave at –90.31dBFS, 16-bit data (left channel blue, right red).
Fig.8 Weiss 204, waveform of undithered 1kHz sinewave at –90.31dBFS, 24-bit data (left channel blue, right red).
When I played undithered data representing a tone at exactly –90.31dBFS, which consists of data at –1LSB, digital zero, and +1LSB, the waveform was symmetrical, and the three DC voltage levels described by the data were clearly defined (fig.7). With undithered 24-bit data, the Weiss DAC204 output a superbly clean sinewave (fig.8).
Fig.9 Weiss 204, spectrum of 24-bit 1kHz sinewave, DC–1kHz, at 0dBFS into 200k ohms (left channel blue, right red, linear frequency scale).
Fig.10 Weiss 204, HF intermodulation spectrum, DC–30kHz, 19+20kHz at 0dBFS into 600 ohms, 24-bit, 44.1kHz data (left channel blue, right red; linear frequency scale).
The Weiss 204's distortion was primarily third harmonic, this lying at –114dB (0.0002%) with a 1kHz signal at 0dBFS (fig.9). Intermodulation distortion with 24-bit data representing an equal mix of 19 and 20kHz tones, each at –6dBFS, was extremely low in level, even into 600 ohms (fig.10).
Fig.11 Weiss 204, 16-bit TosLink data, high-resolution jitter spectrum of analog output signal, 11.025kHz at –6dBFS, sampled at 44.1kHz with LSB toggled at 229Hz (left channel blue, right red). Center frequency of trace, 11.025kHz; frequency range, ±3.5kHz.
Fig.12 Weiss 204, 24-bit TosLink data, high-resolution jitter spectrum of analog output signal, 11.025kHz at –6dBFS, sampled at 44.1kHz with LSB toggled at 229Hz (left channel blue, right red). Center frequency of trace, 11.025kHz; frequency range, ±3.5kHz.
The Weiss 204 was immune to jitter with all its inputs. Fig.11 shows the spectrum of its output when it was fed 16-bit optical J-Test data. The odd-order harmonics of the undithered low-frequency, LSB-level squarewave all lie at the correct levels; and the noisefloor between those harmonics is vanishingly low in level, as it was with 24-bit J-Test data (fig.12).
The measured performance of the Weiss 204 is state of the digital art.—John Atkinson
Footnote 1: I asked Daniel Weiss how the S/N ratio varies with the attenuation setting. His answer: For a full-scale (0dBFS) input, the S/N ratio varies from 112dB with no attenuation to 108dB with attenuation of 30dB. For a –40dBFS input, the S/N ratio varies from 123dB to 109dB under the same conditions.—Jim Austin